


Community-acquired pneumonia (CAP) remains a common and serious infection with wide variability in intra-hospital mortality.
MethodsWe performed a retrospective analysis of adult patients admitted with CAP in mainland Portugal between the years 2000 and 2009.
ResultsThe intra-hospital mortality rate was 20.4% with deaths in all age groups. The average age of deceased patients was 79.8 years, significantly higher than surviving patients with 71.3 years. Patients aged 50 or more presented a relative risk of death 4.4 times the risk of patients under this age group. Likewise, in patients aged 65 or more the risk of death was 3.2 times the risk of patients <65 years. Men died more at a younger age than women, the men who died were, on average, 4 years younger than women, 78.1 vs 82.1 years old. Relative risk of death in men was 17% higher than women after adjustment for year of admission and age.
ConclusionCAP remains an important cause of hospital mortality in all age groups.
Community-acquired pneumonia (CAP) is an important cause of morbidity and mortality as well as expenditure of health resources. A higher incidence of this disease was reported in men and older patients.1
Several studies2–4 in the last decade showed an increase in hospital admissions for CAP. Portugal was no exception.5 Between 2000 and 2009 CAP was responsible for 3.7% of all hospital admissions which increased to 7% in patients ≥65 years of age.5
CAP is the leading cause of death by infectious disease in developed countries,6 it is the eighth cause of death in the United States (US) in 2014.7 In a US study with 33,000 patients conducted in 1996, CAP intra-hospital mortality was 13.6% increasing to 36.5% in ICU patients.8
In European countries, mortality due to CAP varies. In a 2012 review with more than 30 studies performed over 9 European countries, Welte et al.1 concluded that variability of intra-hospital mortality in CAP was significantly related to several factors. This led to mortality rates of between 1.0% and 43% depending on age (≥65 years), co-morbidities, severity (multilobar pneumonia, septic shock, ICU admission), immune status, antibiotic sensitivity and response to treatment.
In Portugal, the mortality rate in adults admitted with CAP between 1998 and 2000 was 17.3% without gender predominance.9 Mortality was greater in older patients, ranging from 4.5% in those younger than 50 years, 19.4% in patients ≥50 years and 21.4% in those older than ≥65 years.9
The present study aims to describe the evolution of intra-hospital mortality within the Portuguese adult population admitted with CAP between 2000 and 2009 and understand its distribution by age and gender.
MethodsData was gathered through the Central Administration of the National Health System (NHS) which has clinical data for all patients admitted to Portuguese NHS hospitals. This covers nearly the entire resident population of mainland Portugal. Medical data, including diagnosis and procedures, were encoded from the discharge summaries by trained physicians using the International Classification of Diseases, 9th Revision – Clinical Modification (ICD-9-CM).
In this study, we retrospectively analyzed the hospital admissions of adults with a primary diagnosis of pneumonia (ICD-9-CM 480-486 and 487.0) between the years 2000 and 2009. We then analyzed all inpatient deaths regardless of the length of hospital stay. These codes excluded tuberculosis pneumonia, obstructive pneumonia (e.g. associated with lung cancer), patients under 18 years of age and those for whom pneumonia was not the main diagnosis. As ICD-9-CM does not specify whether pneumonia is community acquired, we excluded patients with HIV (ICD-9-CM 042-044 and/or diagnosis-related groups 488, 489 and 490), individuals who were immunocompromised by anti-cancer or immunosuppressive treatment (external cause of disease code E933.1) and transplant recipients (V42).
Patient anonymity was maintained throughout clinical analysis. Comparison of the mean age between groups was performed using the Student's T test or the Mann–Whitney test when the assumptions of the T test were not observed. The risk of death was compared between age groups, gender and year of admission with the chi-squared test. The relative risk of inpatient death was calculated for each group as well as the 95% confidence interval. To measure the effect of each variable (age group, gender and year of admission) on the risk of death adjusted to the other variables, a log-binomial regression was used. All tests used had a significance level set at 5%. Data analysis was performed using SPSS20 and STATA SE 11.
ResultsAnnual intra-hospital mortality ratesBetween the years 2000 and 2009, 294,027 adults were admitted to hospital with a main diagnosis of CAP. Of those, 59,925 (20.4%) died during their hospital admission.
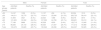
Table 1 represents the inpatient mortality rate per year of admission between 2000–2004 and 2005–2009. The annual mortality rate showed a steady increase between the period 2000–2004 and 2005–2009 with a constant rise of 13.2%, except for the years 2007 and 2009.
Evolution of intra-hospital mortality rate between 2000 and 2009.
| Year | Total admissions | Deaths (%) | |
|---|---|---|---|
| 2000 | 23,679 | 4046 | (17.1%) |
| 2001 | 22,442 | 4147 | (18.5%) |
| 2002 | 26,093 | 4930 | (18.9%) |
| 2003 | 27,978 | 5549 | (19.8%) |
| 2004 | 26,582 | 5366 | (20.2%) |
| 2005 | 31,302 | 6569 | (21.0%) |
| 2006 | 29,131 | 6320 | (21.7%) |
| 2007 | 33,726 | 7235 | (21.5%) |
| 2008 | 34,083 | 7652 | (22.5%) |
| 2009 | 39,011 | 8111 | (20.8%) |
| 2000–2004 | 126,774 | 24,038 | (19.0%) |
| 2005–2009 | 167,253 | 35,887 | (21.5%) |
| Total (2000–2009) | 294,027 | 59,925 | (20.4%) |
The patients admitted with a primary diagnosis of CAP had a mean age of 73.1 years (standard deviation – SD: 16.0). The deceased patients had a mean age of 79.8 years (SD: 11.3) and a median age of 82 years. This was significantly higher than the mean age of the surviving patients with 71.3 years (p<0.01).
The inpatient mortality rate for male patients was 20.7% while in female population it was 20.0% (p<0.01). Within the total of deceased patients, 56.5% were male with a mean age of 78.1 years and 43.5% were female with a mean age of 82.1 years. The difference between the mean ages in both groups was statistically significant (p<0.01).
There were deaths in all age groups, however, the lowest mortality rate was observed in those aged 29 years with a mortality rate of 1.7%.
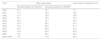
Table 2 represents the mortality rate of admitted patients by gender and age group (<50, ≥50, <65, ≥65, <75, ≥75 years).
Intra-hospital mortality by gender and age groups (age inferior or equal to and greater than 50, 65 and 75 years).
| Male | Female | Total | |||||||
|---|---|---|---|---|---|---|---|---|---|
| Age groups (years) | Admitted patients | Deaths (%) | Admitted patients | Deaths (%) | Admitted patients | Deaths (%) | |||
| <50 | 19,167 | 1059 | (5.5%) | 11,137 | 456 | (4.1%) | 30,304 | 1515 | (5.0%) |
| ≥50 | 144,311 | 32,770 | (22.7%) | 119,411 | 25,640 | (21.5%) | 263,723 | 58,410 | (22.1%) |
| <65 | 41,855 | 3527 | (8.4%) | 23,520 | 1388 | (5.9%) | 65,376 | 4915 | (7.5%) |
| ≥65 | 121,623 | 30,302 | (24.9%) | 107,028 | 24,708 | (23.1%) | 228,651 | 55,010 | (24.1%) |
| <75 | 77,186 | 9686 | (12.5%) | 45,528 | 4259 | (9.4%) | 122,715 | 13,945 | (11.4%) |
| ≥75 | 86,292 | 24,143 | (28.0%) | 85,020 | 21,837 | (25.7%) | 171,312 | 45,980 | (26.8%) |
| Total | 163,478 | 33,829 | (20.7%) | 130,548 | 26,096 | (20.0%) | 294,027 | 59,925 | (20.4%) |
Regardless of gender, the risk of death increased with age. The relative risk of death for patients aged 50 or more was 4.4 times (CI95% 4.2–4.7) the risk for those under this age group. In the population ≥65 years the relative risk of death was 3.2 times (CI95% 3.1–3.3) the risk of the <65 years population (p<0.01).
Table 3 represents the annual evolution of mean age and mortality rate in patients admitted and deceased between the years 2000 and 2009. Except for 2009, there was a consistent annual increase in the mean age as well as mortality rate.
Mean ages and intra-hospital mortality rates of admitted and deceased patients between 2000 and 2009.
| Year | Mean age (years) | Intra-hospital mortality rate (%) | |
|---|---|---|---|
| Admitted patients (N: 294,027) | Deceased patients (N: 59,925) | ||
| 2000 | 70.1 | 78.1 | 17.1 |
| 2001 | 71.3 | 78.3 | 18.5 |
| 2002 | 71.6 | 79.0 | 18.9 |
| 2003 | 72.1 | 79.3 | 19.8 |
| 2004 | 73.3 | 79.7 | 20.2 |
| 2005 | 73.8 | 80.0 | 21.0 |
| 2006 | 73.8 | 80.0 | 21.7 |
| 2007 | 74.2 | 80.5 | 21.5 |
| 2008 | 75.0 | 80.8 | 22.5 |
| 2009 | 73.6 | 80.7 | 20.8 |
| 2000–2009 | 73.1 | 79.8 | 20.4 |
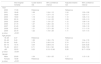
Table 4 represents the relative risk of death adjusted for year of admission, age and gender. The relative risk of death varied significantly between 2001 and 2009 when compared to 2000.
Intra-hospital mortality adjusted for year of admission, age groups and gender.
| Intra-hospital mortality | Crude relative risk | 95% confidence interval | Adjusted relative risk | 95% confidence interval | |
|---|---|---|---|---|---|
| Year | |||||
| 2000 | 17.09 | Reference | Reference | ||
| 2001 | 18.48 | 1.08 | 1.04–1.12 | 1.04 | 1.00–1.08 |
| 2002 | 18.89 | 1.11 | 1.07–1.15 | 1.07 | 1.03–1.11 |
| 2003 | 19.83 | 1.16 | 1.12–1.20 | 1.10 | 1.06–1.14 |
| 2004 | 20.19 | 1.18 | 1.14–1.23 | 1.09 | 1.05–1.13 |
| 2005 | 20.99 | 1.23 | 1.19–1.27 | 1.12 | 1.08–1.16 |
| 2006 | 21.70 | 1.27 | 1.26–1.32 | 1.14 | 1.10–1.18 |
| 2007 | 21.45 | 1.26 | 1.21–1.30 | 1.13 | 1.09–1.16 |
| 2008 | 22.45 | 1.31 | 1.27–1.36 | 1.15 | 1.11–1.19 |
| 2009 | 20.79 | 1.22 | 1.18–1.26 | 1.11 | 1.07–1.14 |
| p-value | <0.001 | ||||
| Age groups | |||||
| 18–29 | 3.47 | Reference | Reference | ||
| 30–49 | 5.43 | 1.56 | 1.36–1.79 | 1.54 | 1.34–1.76 |
| 50–64 | 9.69 | 2.79 | 2.45–3.18 | 2.74 | 2.41–3.12 |
| 65–74 | 15.75 | 4.54 | 3.99–5.16 | 4.47 | 3.94–5.08 |
| 75–84 | 23.31 | 6.71 | 5.91–7.62 | 6.65 | 5.85–7.55 |
| ≥85 | 32.03 | 9.23 | 8.12–10.48 | 9.28 | 8.17–10.54 |
| p-value | <0.001 | ||||
| Gender | |||||
| Male | 20.69 | 1.04 | 1.02–1.05 | 1.17 | 1.15–1.18 |
| Female | 19.99 | Reference | Reference | ||
| p-value | <0.001 | ||||
Data shows a steady increase in mortality rate by age group, with a small variation of relative risk after adjusting for year of admission and gender.
The risk of death was higher in males and this difference was even higher when adjusted for year of admission and age. Men had a 17% higher relative risk of death than women.
DiscussionFrom 2000 to 2009 the overall intra-hospital mortality rate for patients admitted with CAP in mainland Portugal was 20.4%. This is within the range observed in a European review published in 20121 with an intra-hospital mortality rate ranging between 1% and 43%. Like the European study in our analysis mortality also increased with age, with those ≥75 having a mortality rate of 26.8%, more than twice than those <75, which had 11.4% mortality rate. This was irrespective of year of admission and gender. There were deaths in all age groups with a highlight 5.0% mortality rate in patients younger than 50 years old. Over the studied period inpatient mortality rate showed a steady increase, with two exceptions: 2007 and 2009. These accompanied changes in the mean age of hospitalized and deceased patients. The average age of deceased patients was significantly higher, 79.8 years, against 71.3 years in surviving patients.
After adjustment for age and gender, the increase in the relative risk of death during hospitalization over the years maintained statistical significance, with an 11% raise between 2000 and 2009. Patients aged 50 or more had a relative risk of death 4.4 times the risk of patients under this age group. Likewise, in patients aged 65 or more the risk of death was 3.2 the risk of patients <65. More men died and at a younger age than women. The mean age of deceased men was 78.1 years, 4 years younger than the mean age of deceased women which was 82.1 years. Relative risk of death in men was 17% higher than in women after adjustment for year of admission and age.
Our study has several limitations. Primarily, it is a retrospective study that uses an administrative database with coded information from discharge summaries. However, in Portugal, codification is done only by medical doctors with specific training. The process is regularly internally and externally audited which contributes to guarantee accuracy. Due to the lack of a specific CAP code in ICD-9-CM, we only analyzed adult hospital admissions where the main diagnosis was pneumonia. Patients with a main diagnosis of respiratory failure or sepsis associated to a secondary diagnosis of pneumonia were not included. The latter could be associated with a higher mortality rate10 but also with nosocomial pneumonia. Still, we acknowledge the possibility that some cases of hospital-acquired pneumonia could have been included in our study. This is possible due to coding error but also because the database does not allow for discrimination of pneumonia after recent hospital discharge, hence pneumonia that is not strictly community acquired. Similarly, it is not possible to identify patients living in nursing homes or using long-term care facilities, hence it is expected that cases of healthcare-associated pneumonia have been included, particularly in the elderly. However, this concept and its inclusion in nosocomial pneumonia remain the source of controversy for some authors in Europe.11 The methodology used made it impossible to exclude all rehospitalizations of the same patient with pneumonia during the period studied, so the calculated values refer to hospital admissions.
The greater accessibility to hospital institutions and the fear of dying at home, both for patients and their families, might explain the inclusion of patients with end-of-life pneumonia. These will likely have a higher impact in the older age groups.
The methodology used allowed for the exclusion of patients with tuberculosis, obstructive pneumonia, those with HIV, recipients of transplanted organs, the immunosuppressed and those under treatment for cancer.
In this study, the length of hospitalization was not assessed, which could have contributed to a greater specificity of the methodology.12 It was neither possible to obtain information on mortality at 30 days after hospital admission or to identify the subset of patients requiring ICU admission. Our database had no information on pneumonia severity, co-morbidities or immunization status, regarding influenza or pneumococcal disease. Despite these limitations, the methodology used has been considered valid and is applied in multiple studies carried out in different countries.3,5,9,13–15
This study has the advantage of analysing a period of 10 years, minimizing the impact of years that deviate from normality, such as 2009, when the A(H1N1) influenza pandemic occurred. Regarding the year 2009, there were more CAP admissions5 and this could be related to the influenza pandemic, but, this did not impact on intra-hospital mortality, which was lower in 2009 than in previous years. Mean age of admission could be a contributing factor to lower mortality since it was lower in 2009. According to Portuguese official data there were 124 deaths attributable to the influenza pandemic through serologic testing (1.17 deaths per 100,000 inhabitants) with a mean age of 47.6 years.16 In summary, during the influenza pandemic there were more admissions of young patients with CAP.
The database analysis could not identify factors contributing to the annual increase in intra-hospital mortality rates even after adjusting for age, gender or the higher risk of death in males. Factors such as smoking, alcoholism, severity of pneumonia, clinical management of the disease and, above all, the increasing prevalence of comorbidities in the Portuguese population may be associated with the increase in mortality.
CAP remains an important cause of hospital mortality in all age groups. Further studies are needed to better understand which factors are associated with the annual increase in intra-hospital mortality rates. However our study fully justifies the adoption of lifestyle-modifying measures as well as greater appreciation of anti-influenza and anti-pneumococcal vaccinations.17
Conflicts of interestDr. Froes reports personal fees and non-financial support from Pfizer, personal fees and non-financial support from MSD, personal fees and non-financial support from TEVA, non-financial support from Sanofi, non-financial support from AstraZeneca, non-financial support from Bayer, personal fees from Novartis, outside the submitted work.
Dr. Teixeira-Lopes and the other co-authors have nothing to disclose.
The authors would like to thank Prof. Cristina Bárbara (CHLN, FML), Prof. Ana Escoval (ENSP, UNL) and the ACSS/MS, in particular, F. Cardoso and L. Faustino, for allowing us to access the database.


