


The diagnosis and severity assessment of COPD relies on spirometry, and in particular the FEV1. However, it has been proposed that hyperinflation and air-trapping are better predictors of exercise capacity and mortality than the FEV1.
Researchquestion
Does static hyperinflation predict exercise capacity?
MethodsWe conducted an observational prospective study. Patients with COPD referred to the lung function laboratory were consecutively recruited. Patients with hyperinflation (the experimental group) were compared to patients without hyperinflation (the control group). The sample sizes were determined assuming an effect size of 0.5 and a power of 0.80.
ResultsWe recruited 124 participants, of whom 87% were male, the mean age was 66.1 ± 8.8 years. 67% were symptomatic (GOLD B or D). Airflow limitation was moderate to severe in the majority of patients (median FEV1 47%, IQR 38-65%) and 43% of patients had static hyperinflation. The median 6MWD was 479 meters (404-510) and peak workload in CPET was 64 watts (46-88) with peak VO2 1.12 L/min, 0.89-1.31 L/min. Patients with lower FEV1, DLCO and IC/TLC and higher RV/TLC had reduced exercise capacity in both 6MWT and CPET, measured as lower distance, greater desaturation and ∆Borg dyspnoea, and reduced workload, peak VO2 and peak VE and higher desaturation and ventilatory limitation (VE/MVV). An IC/TLC < 0.33 predicted reduced exercise performance (peak O2 <60%). Dyspnoea assessed by mMRC and QoL measured by CAT and CCQ were also worse in the hyperinflation in COPD patients.
ConclusionIn COPD patients, IC/TLC and RV/TLC are valuable predictors of exercise performance in both 6MWT and CPET and PRO.
Chronic obstructive pulmonary disease (COPD) is a common, progressive and debilitating disease characterized by symptoms of breathlessness and reduced exercise capacity. Spirometry demonstrating post-bronchodilator airflow obstruction is mandatory to establish the diagnosis.1 However, symptoms, especially dyspnoea and exercise intolerance, cannot be accurately predicted from the resting lung function parameters, including the severity of the airflow obstruction (FEV1), diffusion capacity for carbon monoxide (DLCO), or arterial blood gases.2,3 In fact, the parameters usually used to define COPD and its severity predict symptoms and mortality poorly.4 Thus, exercise capacity has emerged as an important prognostic indicator in COPD,5,6 and exercise testing is increasingly used to evaluate patients with COPD. The six-minute walk test (6MWT) is the most commonly used exercise test, but cardiopulmonary exercise test (CPET) is considered the gold standard to study a patient's level of exercise limitation and assess its cause.7,8 CPET indices, including peak oxygen uptake (VO2 peak), ventilatory equivalents for carbon dioxide production (VE/VCO2) and arterial oxygen saturation (SpO2), provide important functional and prognostic information, and have proved to be better predictors of prognosis than lung function measurements obtained at rest.9-12 Dyspnoea is the most common exercise-limiting symptom in advanced COPD, but leg discomfort is also frequently reported.13,14 In COPD, the loss of lung elastic recoil and progressive expiratory airflow limitation promote air trapping, with increased functional residual capacity (FRC) and decreased inspiratory capacity (IC).15 The inability to increase expiratory flow at the resting end-expiratory lung volume in the face of expiratory-flow limitation means that end-expiratory lung volume must increase if gas exchange is to be maintained near normal values - dynamic hyperinflation. Dynamic hyperinflation can be reliably measured from the inspiratory capacity manoeuvre.6 The limitation of expiratory flow may also be influenced by inspiratory muscle strength16 and the extent of the mechanical load imposed upon the muscles. A lower IC is observed when ventilation is taking place close to the total lung capacity, as is tends to occur with dynamic hyperinflation.6 Recent studies have demonstrated that although static IC may be within the normal range in patients with mild airway obstruction (GOLD stage I), residual volume (RV) and functional residual capacity (FRC) may be elevated indicating early hyperinflation.17 Hyperinflation can be assessed from the total lung capacity (TLC) and inspiratory capacity to total lung capacity ratio (IC/TLC), and air trapping measured by residual volume (RV) and residual volume to total lung capacity ratio (RV/TLC). These measurements are invaluable when classifying COPD and should be part of routine characterisation of these patients. Static hyperinflation and dynamic hyperinflation have been associated with the intensity of breathlessness and exercise intolerance in COPD patients.14,18-20 There is also a correlation between decreased exercise capacity (defined by maximum load achieved on a cycle ergometer), a lower IC/TLC ratio and higher mortality, regardless of FEV1.21-23
Although peak VO2 obtained from cardiopulmonary exercise testing (CPET) has been shown to be a predictor of mortality in COPD, CPET is not always readily available or cost effective.24 Thus, the 6MWT, a quick, reproducible, robust and cheaper exercise test, has been increasingly used to complement the functional evaluation of patients with COPD.25 The variation in the distance covered on the 6MWT correlates with changes in spirometry26,27 and predicts mortality in patients with COPD11,28,29 better than FEV1 and regardless of accompanying comorbidities.15,29
The primary objective of this study was to investigate whether total lung capacity (TLC), inspiratory fraction (IC/TLC) and air-trapping (RV/TLC) might be useful in predicting maximal exercise capacity as measured with 6MWT and CPET in COPD patients, across all GOLD severity stages. Thus, the hypothesis under consideration is that the exercise capacity, measured by the mean values of 6MWT and CPET, are significantly different across the two groups (hyperinflated COPD patients and non-hyperinflated COPD patients).
Material and methodsType of study and patient's selectionSingle-centre, prospective study to evaluate the relationship between lung function, specifically hyperinflation and air-trapping, on exercise capacity in COPD patients.
The study protocol and all amendments were reviewed by the Ethics Committee (CHVNG – 199/2018). The study was conducted according to the ethical principles of the Declaration of Helsinki. Written informed consent was obtained from all patients before any assessment was performed.
Patients with stable chronic obstructive pulmonary disease (COPD) according to the Global Initiative for Chronic Obstructive Lung Disease (GOLD) 2017 strategy30 with hyperinflation (defined as TLC>120%) and air-trapping (defined as RV>120% and RV/TLC>120%)31 and COPD patients without hyperinflation or air-trapping identified in the lung function laboratory of Centro Hospitalar Vila Nova de Gaia/Espinho (CHVNG/E) between October 2018 and March 2019 capable of completing exercise tests (cyclergometry – incremental protocol and 6MWT) and QOL questionnaires were included, irrespective of their age, smoking history and GOLD stage. All bronchodilators and corticosteroid medication were allowed in the study.
Exclusion criteria were a current documented diagnosis of asthma; a diagnosis of thyrotoxicosis; a history of myocardial infarction within 6 months; life-threatening cardiac arrhythmia; known active tuberculosis; patients with severe emphysema requiring endobronchial interventions within 6 months prior to screening; pregnancy.
Data collection methodsWith the patients’ consent, data were collected by the authors (pulmonology physicians and cardiopulmonary technicians). Spirometry, lung volume assessment with plethysmography and 6MWT were performed by the pulmonary function testing laboratory cardiopulmonary technicians.
Patients performed pulmonary function testing according to ATS/ERS guidelines,32 including routine post-bronchodilator spirometry33 and lung volumes measurement with plethysmography.34 Resting arterial oxygen pressure (pO2) and resting arterial carbon dioxide (pCO2) pressure were measured in 2 mL blood drawn from the radial artery with a pre-heparinized syringe and immediately analysed using an ABL 90 flex plus blood gas analyser (Radiometer, Copenhagen, Denmark).
Modified Medical Research Council (MRC) dyspnoea scale, COPD Assessment Test (CAT), COPD Clinical Questionnaire (CCQ) were collected before respiratory testing.
The symptom-limited CPET followed ATS/ACCP standards.35,36 Patients were subjected to symptom-limited incremental exercise with progressively increasing work rate (increment selected to maintain exercise for 8–10 min) until fatigue was reached. Patients were evaluated with breath-by-breath monitoring of cardiopulmonary variables [O2 uptake (VO2), CO2 output (VCO2), minute ventilation (VE), heart rate (HR)], assessment of perceptual responses (dyspnoea and leg discomfort measured by BORG scale37) and measurements such as exercise-related arterial oxygen desaturation and dynamic hyperinflation. Although there has been increasing interest in lung hyperinflation in COPD patients, no single standardized marker or criterion for hyperinflation has been established to date. In this study, dynamic hyperinflation was assessed by measuring IC repeatedly during CPET. Patients were required to take a deep inspiration, after normal expiration, at predetermined intervals of 2 min.12 Ventilatory limitation at peak exercise was defined by a VE/maximum voluntary ventilation (MVV) above 85%.38,39
Exercise tolerance measured using the 6MWT followed the recommendations of the ATS.40-42 We collected the maximum distance in meters and percentage of predicted value,43 BORG scale37 and oxygen desaturation. Oxygen desaturation was defined according to the Royal College of Physicians' guidelines as a ≥4% reduction between arterial oxygen saturation measured by pulse oximetry pre- and post-test (Δ SpO2 ≥4%) and post-test SpO2 <90%.11,44 Each patient did only one 6MWT mainly due to staff and time constraints. Furthermore, according to ERS/ATS guidelines, the learning effect of a second test is especially important when the 6MWT is used to evaluate response to treatment or change over time, which were not aims of this study, and the importance of the learning effect of a second 6MWT for individuals who have previously performed multiple 6MWTs is difficult to establish, as few data are available. Use of oxygen during the test was standardised, if required. Participants were permitted to stop during the test if their symptoms became intolerable but were encouraged to resume the walking as soon as possible. The 6MWTs were monitored by a single operator who recorded the 6MWD (6-minute walk distance) at the same time. The distance walked in the test was reported in meters and as a percentage of predicted value using reference equations previously developed for healthy population.43
Statistical analysisA difference of 50m in the 6MWT between the control and the experimental group was considered clinically relevant45 with a standard deviation of 95 meters, based on literature and experience of the hospital.43 Thus, an approximate effect of 0.5 was expected. The sample sizes for the experimental group and the control group, according to hyperinflation and air-trapping, were determined assuming a significance level of 0.05 and a power of 0.80, which implied 64 subjects in each group. The calculations were performed using G*Power (t-tests: difference between two independent means).
Groups were compared using t-test, for quantitative variables, chi-square tests for categorical variables and ANOVA for several groups. The association between the outcomes and independent variables was studied through regression. In the event that the assumptions of the parametric tests were not observed, in particular normality and homogeneity of variances, non-parametric tests were used such as Mann-Whitney-Wilcoxon tests and Kruskal-Wallis. Correlation was evaluated by Pearson coefficient or the non-parametric Spearman rank. A significant level of p = 0.05. A cut-off value for IC/TLC was investigated through Receiver Operating Characteristic (ROC) curve. All analyses were carried out using SPSS 26.
Results132 patients were screened. 6 patients were excluded due to inability to perform exercise tests (5 patients had physical limitations and 1 patient had morbid obesity) and 2 patients did not show up on the day the exam was scheduled.
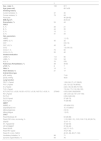
Table 1 shows the main clinical and functional characteristics of the 124 study participants at baseline. The patients were mostly male (87%) with a mean ± standard deviation (SD) age of 66.1±8.8 years. The majority of patients were very symptomatic (67% GOLD B or D). Airflow limitation was moderate to severe in the majority of patients (median FEV1 was 47% of predicted, interquartile range (IQR) 38-65%). Static hyperinflation and air-trapping was present in 53 patients (43%). A total of 8 patients (7%) were on continuous long-term oxygen therapy and 49 patients (40%) were enrolled in pulmonary rehabilitation programs.
Characteristics of study participants.
Data expressed as mean ± SD or median (IQR) and n/% for qualitative variables.
BMI: body mass index; GOLD: Global Initiative for Chronic Obstructive Lung Disease; QoL: quality of life; mMRC: modified medical respiratory council dyspnoea scale; CAT: COPD assessment test; CCQ: Clinical COPD Questionnaire, LABA: long acting beta agonist; LAMA: long acting muscarinic antagonist; ICS: inhaled corticosteroid; LTOT: long term oxygen therapy; OSA: Obstructive sleep apnoea; PaO2: arterial pressure of oxygen; PaCO2: arterial pressure of carbon dioxide; FEV1: Forced Expiratory Flow in 1sec; FVC: Forced Vital capacity; IC: inspiratory capacity; TLC: total lung capacity; RV: residual volume; DLCO: lung diffusion capacity for carbon monoxide; KCO: carbon monoxide transfer coefficient; 6MWT: 6-minute walk test; 6MWD: 6-minute walk distance; m: metre; %:percentage; SpO2: pulse oxygen saturation; CPET: Cardiopulmonary exercise test; peak W: peak incremental cycle work rate; peak VO2: peak oxygen uptake; AT: Anaerobic threshold; VE/VCO2: minute ventilation/carbon dioxide production; peak O2/HR: peak oxygen pulse; VE: minute ventilation; MVV: maximal voluntary ventilation; HR: heart rate; bpm: beats per minute; W: watt; L: liters, %pred: percentage predicted, ml: millilitre; min: minute; n: number; min: minimum; mmHg: millimetre of mercury.
The median 6MWD was 479 meters (IQR 404-510 m), with median ∆SpO2 -5% (-9–3%) and minimum spO2 89±3%. The median workload in CPET was 64 watts (IQR 46-88) with median peak VO2 1.12 L/min (IQR 0.89-1.31 L/min (15.5 mL/min/kg, IQR13.6-17.8 mL/min/kg). Median O2 pulse was 9.2 (IQR 7.7-10.7). Median peak VE was 40 L/min (IQR 31-49) and 89% of maximum voluntary ventilation (MVV) with 71% of patients presenting ventilatory limitation in CPET and 76% showing dynamic hyperinflation during CPET.
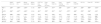
Lower FEV1, DLCO and KCO (%predicted) were associated with reduced exercise capacity in the 6MWT - lower distance, higher desaturation and ∆Borg dyspnoea and in CPET – reduced workload, reduced peak VO2, higher desaturation during test and reduced peak VE as well as higher ventilatory limitation (VE/MVV %predicted) (Table 2).
Correlation of functional variables with exercise capacity (significant correlations on bold, * p < 0.05, ** p < 0.01).
FEV1: Forced Expiratory Flow in 1sec; FVC: Forced Vital capacity; IC: inspiratory capacity; TLC: total lung capacity; RV: residual volume; DLCO: lung diffusion capacity for carbon monoxide; KCO: CO transfer coefficient; 6MWT: 6-min walk test; m: metre; %:percentage; SpO2: pulse oxygen saturation; CPET: Cardiopulmonary exercise test; peak W: peak incremental cycle work rate; peak VO2: peak oxygen uptake; AT: Anaerobic threshold; VE/VCO2: minute ventilation/carbon dioxide production; peak O2/HR: peak O2 pulse; VE: minute ventilation; MVV: maximal voluntary ventilation; HR: heart rate; bpm: beats per minute; W: watt; L: litres; %pred: percentage predicted, ml: millilitre; min: minute; n: number; min: minimum; mmHg: millimetre of mercury.
Similarly, static hyperinflation (i.e., low IC/TLC) and air-trapping (i.e., high RV/TLC) were associated with reduced exercise capacity in the 6MWT - lower distance, higher desaturation and ∆Borg dyspnoea and in CPET – reduced workload, reduced peak VO2 and reduced peak VE with higher ventilatory limitation (Table 2). Hyperinflation was also associated with higher desaturation during CPET.
TLC (%predicted) was not correlated with any variable of 6MWT. Higher RV (%predicted) was associated with dyspnoea augmentation during 6MWT. In CPET, TLC correlated weakly with ventilatory limitation as well as RV, but higher RV was also associated with lower workload and reduced peak VO2.
A reduced peak O2 (<60% predicted in CPET) and thus a greater disability in these COPD patients was associated with IC/TLC < 0.33 (Fig. 1).
 analysis of IC/TLC for prediction of impaired exercise capacity measured in CPET (peak VO2<60%). With the cut off value of 0.33 for the IC/TLC, the area under the curve was 0.720 (95% confidence interval, 0.628 to 0.813; p < 0.005) with the sensitivity of 78% and specificity of 60%.")
Receiver operating characteristic curve (ROC) analysis of IC/TLC for prediction of impaired exercise capacity measured in CPET (peak VO2<60%). With the cut off value of 0.33 for the IC/TLC, the area under the curve was 0.720 (95% confidence interval, 0.628 to 0.813; p < 0.005) with the sensitivity of 78% and specificity of 60%.
When comparing the group of COPD patients with hyperinflation and air-trapping with the non-hyperinflated group, we found lower FEV 1 (43% (31-54) versus 50% (39-69), lower mean arterial oxygen (pO2 68±9 mmHg versus 72±9 mmHg) and more severe static hyperinflation (IC/TLC ≤ 0.25 in 32% of patients versus 14%) - Table 3. Patients with hyperinflation and air-trapping had more ventilatory limitation in CPET (87% versus 59%), although no difference was found in exercise performance either in CPET or 6MWT between groups.
Characteristics of COPD patients according to the presence of hyperinflation and air-trapping.
Data expressed as mean ± SD or median (IQR) and n/% for qualitative variables.
BMI: body mass index; GOLD: Global Initiative for Chronic Obstructive Lung Disease; QoL: quality of life; mMRC: modified medical respiratory council dyspnoea scale; CAT: COPD assessment test; CCQ: Clinical COPD Questionnaire, LABA: long acting beta agonist; LAMA: long acting muscarinic antagonist; ICS: inhaled corticosteroid; LTOT: long term oxygen therapy; OSA: Obstructive sleep apnoea; PaO2: arterial pressure of oxygen; PaCO2: arterial pressure of carbon dioxide; FEV1: Forced Expiratory Flow in 1sec; FVC: Forced Vital capacity; IC: inspiratory capacity; TLC: total lung capacity; RV: residual volume; DLCO: lung diffusion capacity for carbon monoxide; KCO: carbon monoxide transfer coefficient; 6MWT: 6-min walk test; 6MWD: 6-minute walk distance; m: metre; %:percentage; SpO2: pulse oxygen saturation; CPET: Cardiopulmonary exercise test; peak W: peak incremental cycle work rate; peak VO2: peak oxygen uptake; AT: Anaerobic threshold; VE/VCO2: minute ventilation/carbon dioxide production; peak O2/HR: peak oxygen pulse; VE: minute ventilation; MVV: maximal voluntary ventilation; HR: heart rate; bpm: beats per minute; W: watt; L: liters, %pred: percentage predicted, ml: millilitre; min: minute; n: number; min: minimum; mmHg: millimetre of mercury.
With regards to patient-reported outcomes (PRO), mMRC and CCQ were significantly higher in patients with hyperinflation (p < 0.01 and p = 0.03) and no difference in CAT was found between groups (Table 3), although a correlation was found between CAT and air-trapping measured by RV% and RV/TLC (0.232 and 0.248, p < 0.01) (Table 4); 43% of the hyperinflated patients had mMRC≥2 versus 24% in non-hyperinflated patients (p = 0.02). Regarding CCQ, 53% of hyperinflated patents had CCQ ≥1.5 and only 34% of non-hyperinflated COPD achieved that cut-off (p = 0.03).
Correlation between symptoms and QoL scales and respiratory function parameters (significant correlations on bold, * p < 0.05, ** p < 0.01).
mMRC: modified medical respiratory council dyspnoea scale; CAT: COPD assessment test; CCQ: Clinical COPD Questionnaire; FEV1: Forced Expiratory Flow in 1sec; FVC: Forced Vital capacity; IC: inspiratory capacity; TLC: total lung capacity; RV: residual volume; DLCO: lung diffusion capacity for carbon monoxide; KCO: CO transfer coefficient; L: liters, %pred: percentage predicted.
Our study found a significant relation between hyperinflation, measured by IC/TLC, and exercise capacity in COPD patients GOLD A-D using 6MWT and CPET.
Increased lung hyperinflation predicted a lower distance walked in the 6MWT as previously suggested,46 but also a higher ∆spO2 and worse dyspnoea, measured by the Borg scale, during the test. Ramon et al36 in 2016, also found that IC/TLC predicted 6MWD decline in moderate-to-severe clinically stable patients with COPD. In our study, IC/TLC ratio had a better capacity to predict exercise capacity than TLC alone or TLC and RV combined. Contrary to our results, Perez et al47 did not show an association between RV and RV/TLC and 6MWD, which the authors attributed to a confounding effect of FEV1 and age. Freitas et al15 published data supporting IC as the greatest determinant of the distance covered on the 6MWT but this is not seen in our study.
Considering CPET, lower IC/TLC was also related to reduced workload, reduced VO2 peak, higher desaturation during test, reduced peak VE and ventilatory limitation as previously suggested by Albuquerque et al18 in COPD patients GOLD stages II-III (reduced VO2 peak in CPET). We were able to identify an IC/TLC cut-off associated with more severe exercise capacity impairment, which has not been previously reported as far as we know. This has the potential to be a useful tool in clinical practice whereby static lung function measurements can be used to predict higher disability in COPD patients. Increased hyperinflation and air-trapping, measured by lower IC/TLC and higher RV/TLC, was also associated with worse O2 pulse (VO2/HR) suggesting that cardiac function and associated exercise tolerance can be influenced by hyperinflation. This was previously suggested in the NETT study, when a decrease in hyperinflation as measured by the RV/TLC after Lung Volume Reduction Surgery (LVRS) and in some patients after medical therapy, was associated with improved O2 pulse (VO2/HR) 6 months following randomization.48 When comparing hyperinflators and non-hyperinflators, the main limitation to the exercise capacity found in CPET was ventilatory, with a significantly more patients in the hyperinflator group who exhausted the ventilatory reserve. Hyperinflation was also associated with more symptoms and a worse QoL, using mMRC and CCQ, and air-trapping predicted worse CAT scores. Symptoms and reduced QoL were previously associated with FEV1 and exercise capacity measure with 6MWD49,50 but our study also demonstrates the impact of hyperinflation and air-trapping on symptoms and worse QoL.
To the best of our knowledge, this is the first prospective study to evaluate the impact of hyperinflation on exercise capacity using CPET and 6MWT simultaneously across all severity stages of COPD. There is no consensus on the ideal method to define and measure static hyperinflation. Both TLC and IC/TLC are considered in several papers, but according to our study, IC/TLC ratio is a better predictor of exercise capacity than TLC alone, or TLC and RV combined. This new data can motivate clinicians to look at lung volumes, especially the IC/TLC ratio, when characterizing and assessing severity in COPD patients. Given our results, reduction in hyperinflation could be considered as a treatment goal in order to improve a COPD patient´s exercise capacity and ability to perform daily activities. LABAs and LAMAs have been shown to impact on static IC rather than a modification of dynamic hyperinflation during exercise,51 and this may correlate better with their beneficial effect on exercise tolerance than their impact on FEV1. Our study did not aim to compare the effect of FEV1 versus hyperinflation on exercise capacity but future research, with sample enlargement, might enrich our knowledge on the utility of lung volumes assessment. IC/TLC may be a better index of impact of COPD on exercise than either FEV1 or other measures of hyperinflation. Also, we did not find major differences between hyperinflators and non-hyperinflators with regards to peak workload and peak VO2 in CPET, and this may be explained by the sensitive definition of hyperinflation adopted (TLC>120%, RV>120%31). We would probably find a greater effect with a higher cut off (e.g., 140%) which might be more clinically relevant. The continuation of our study, with sample increase and subgroup analysis may consolidate our findings.
This prospective study was based on a large set of patients with clinically stable COPD in GOLD stages A-D. The broad inclusion criteria, the sample size and wide spectrum of disease severity are clear strengths of our study, and the presented data can be considered as representative of a ‘real world’ setting of patients referred for lung function assessment. We included non-smokers (6%) as well as smokers or former smoker patients, 40% of patients were enrolled in pulmonary rehabilitation (PR) and 17% patients had coexistent cardiac disease (6 patients had cardiac arrythmias, 2 had valvular disease, 3 had ischemic heart disease and 10 had heart failure). PR may have contributed to the mean distance walked in the 6MWT and VO2 and peak workload in CPET of our study, despite the severity of our patients, as it is known to improve exercise performance with CPET and 6MWT (mean improvements of 11% peak in VO2 and 6.8 w in peak workload and 44 m, respectively12). However, both groups included patients on pulmonary rehabilitation programs and no significative difference was found between them. Clearly heart disease can have an impact on exercise performance,8 but the proportion of patients with heart disease was similar in the two groups (19,7% in the non-hyperinflators group and 13,2% in the hyperinflators group, p = 0,079).
One limitation of the present study is the lack of duplicate 6MWT, though the majority of the included patients had previously performed the test (89%), minimizing the impact of a potential lack of the learning effect. Also, according to the latest ATS/ERS technical standards, a second test is currently mainly recommended for intervention efficacy assessment and comparison over time.42
ConclusionWe found a significant relationship between hyperinflation in COPD patients GOLD A-D and exercise capacity using both 6MWT (distance walked and ∆spO2) and CPET (workload, VO2 peak, desaturation, peak VE, ventilatory limitation and O2 pulse). The IC/TLC ratio was better at predicting exercise capacity measured by both tests than TLC and RV. Hyperinflation and air-trapping were also associated with more symptoms (mMRC) and worse QoL (CCQ and CAT).
Further research can better examine the impact of hyperinflation and air-trapping reduction (through PR, pharmacological interventions or surgery) in QoL and the associations between these PRO and exercise test outcomes.
Author contributionsThe listed authors attest that they made substantial contributions to the conception and design of the study, acquisition, analysis and interpretation of the data; drafting the article or revising it critically for important intellectual content, final approval of the version to be submitted for revision. All authors had full access to all the data in the study and accept responsibility for the submission of this work.
Funding / supportThis research did not receive any specific grant from funding agencies in the public, commercial, or not-for-profit sectors.
We would like to thank Dr. Thomas Whitehead, Pulmonologist in Devon, UK, for providing language help and all the personnel from the lab for their professional assistance with data collection.


