


Uric acid (UA) is the end product of adenosine triphosphate degradation, and could increase due to hypoxia. We investigated the association of UA metabolites with nocturnal hypoxemia, apnea-hypopnea index (AHI), noninvasive mechanical ventilation (NIMV) usage and five-year mortality.
Materials/subjects and methodsWe obtained urinary specimen before and after the night polysomnography in order to measure UA excretion and overnight change in urinary UA/creatinine ratio (ΔUA/Cr) in 75 subjects (14 controls, 15 chronic obstructive pulmonary disease (COPD) without nocturnal hypoxemia (NH), 15 COPD with NH, 16 obstructive sleep apnea syndrome (OSAS) without NH, 15 OSAS with NH). Percentage of time spent below SaO2 of 90% (T90%) for >10% of sleep time was considered as nocturnal hypoxemia. Patients were contacted after 5 years with a questionnaire including information on the use of NIMV treatment (n: 58) and urinary specimen analysis (n: 35).
ResultsT90% was found to be significantly correlated with UA excretion (coefficient: 0.005, 95%CI: 0.003–0.007) and ΔUA/Cr (coefficient: 0.8, 95%CI: 0.3–1.2) after adjustments for age, gender, body mass index and apnea-hypopnea index. Median and IQR (interquartile range) of baseline UA excretion were 0.79 (0.51–0.89) and 0.41 (0.31–0.55) in 10 deceased and 58 surviving patients, respectively (p=0.001). UA excretion median and IQR of baseline and 5 years of NIMV treatment were 0.41 (0.36–0.57) and 0.29 (0.23–0.37), respectively (p=0.01).
ConclusionUA excretion, as a marker of tissue hypoxia, may be useful in the management of OSA and COPD patients.
Obstructive sleep apnea is characterized by recurrent episodes of partial (hypoapnea) or complete (apnea), obstruction of the upper airway during sleep, and is associated with episodes of arousal and/or oxyhemoglobin desaturation.1 Uric acid (UA), which is the end product of adenosine triphosphate (ATP) degradation, increases in body fluids in the case of increased anaerobic metabolism induced by cellular hypoxia.2–5 Increased levels of ATP degradation products in body fluids were reported in clinical conditions with tissue hypoxia, such as infant respiratory distress syndrome,6,7 exercise8–12 and acute respiratory failure.13,14 Hasday and Grum reported that the overnight change in urinary UA/creatinine ratio (ΔUA/Cr) could reflect tissue hypoxia in obstructive sleep apnea syndrome (OSAS).15
Hypoxemia occurs during sleep in the case of OSAS, and during both sleep and daytime in the case of chronic obstructive pulmonary disease (COPD). Since sleep-associated hypoxemia has been implicated in the pathophysiology of several abnormalities of COPD and OSA syndrome, urinary UA, as a marker of tissue hypoxia, may be useful in defining the higher risk groups in relation to these two diseases.16,17
In this study, the correlation of urinary UA and ΔUA/Cr with nocturnal hypoxemia and apnea-hypopnea index (AHI) was investigated in a follow-up study including patients with COPD and patients with OSA syndrome. Additionally, these patients were contacted 5 years later and the correlation between first night UA measurements and mortality and the correlation between the change in UA levels during five years and use of noninvasive ventilation (NIV) treatment were investigated.
Material and methodsPatient selectionThe study enrolled 75 patients, including 31 cases with OSA syndrome, 30 with COPD, and a control group including 14 subjects who were eligible and gave informed consent to participate in this prospective follow-up study. The diagnostic criteria for OSA and CPAP (continuous positive airway pressure) treatment were determined according to the standard criteria published by the American Academy of Sleep Medicine (AASM).18 The criteria are defined below. OSA patients displayed at least two of the following three symptoms: snoring, witnessed apnea, and excessive daytime sleepiness. Their AHI score was 5 or higher in the overnight polysomnography (PSG).18 CPAP treatment was given if AHI>30 or AHI between 5 and 30 with a cardiovascular co-morbidity. OSAS patients did not have COPD defined by spirometry.
Patients were routinely called after 3 months and 1 year periods to our outpatients clinic. For reassessment after 5 years patients were contacted by telephone interview (n=68, 58 alive, 10 died). 35 of them agreed to give uric acid samples (blood and urine) (Fig. 1). The compliance of CPAP use was evaluated after follow-up.

Flowchart of the study procedures. PSG: polysomnography, PFT: pulmonary function tests, UA: uric acid, NIMV: non invasive mechanical ventilation, OSAS NN: obstructive sleep apnea syndrome nocturnal normoxemic, OSAS-NH: obstructive sleep apnea syndrome nocturnal hypoxemic, COPD-NN: chronic obstructive pulmonary disease nocturnal normoxemic, COPD-NH: chronic obstructive pulmonary disease nocturnal hypoxemic.
The recruitment criteria for COPD included a history of 10 or more pack-years of smoking or a history of biomass exposure, a forced expiratory volume in one second (FEV 1) of less than 80% of the predicted value after bronchodilator use and a ratio of FEV 1 to forced vital capacity (FVC) of 0.7 or less after bronchodilator use.19 The condition of the patients was graded according to the stages of disease defined by the Global initiative for chronic Obstructive Lung Disease (GOLD).20 COPD patients had moderate to severe COPD disease without daytime hypoxia.21 Patients who displayed any of the symptoms of snoring and/or witnessed apnea were not enrolled in the study. The AHI scores were below 5 in the overnight PSG. The subjects in the control group had neither OSA nor COPD. They were admitted to the sleep laboratory with a complaint of snoring. Patients with OSA and COPD, who spent >10% of sleep time with oxyhemoglobin saturation (SaO2) below 90% were classified as nocturnal hypoxemic (NH). Personal characteristics and disease-related factors were assessed based on patient records. Flowchart of the subjects and procedures are presented in Fig. 1.
Patients were not enrolled in the study if they had any disease or medication that might alter the metabolism or urinary excretion of uric acid, as in the following:
- 1.
Excessive UA production: Physician-diagnosed gout, diabetes mellitus, hemolytic anemia, myelo-lymphoproliferative disease, psoriasis, Paget's disease, or glucose-6-phosphatase deficiency or glycogen storage disease.
- 2.
Decreased UA excretion: Physician-diagnosed renal failure, acidosis, sarcoidosis, lead intoxication or berylliosis.
- 3.
Medication: Salicylic acid (in excess of 2g/day), diuretic, cyclosporine, levodopa, phenylbutazone (in excess of 200mg/day), ethambutol, pyrazinamide, nicotinic acid, nitroglycerin (intravenous) theophylline, allopurinol.
- 4.
Alcohol intake on the day of PSG and follow-up.
- 5.
Exercise on the day of PSG.
Subjects were asked not to exercise or consume alcohol during the day before the PSG test, which could increase anaerobic metabolism and thus uric acid production. The study protocol was approved by the Institutional Review Board Ethics Committee of the research hospital. Informed consent was obtained from each patient.
PolysomnographyPolysomnography was performed in the Sleep Laboratory with Embla polysomnograph running Somnologica software version 4.0 (Flaga hf. Medical Devices, Iceland) and included four electroencephalography (EEG) channels (C3 to A1, C4 to A2, O1 to A2, O2 to A1), right and left electrooculography (EOG) channels, one chin electromyography (EMG) channel and four tibialis anterior EMG channels, finger pulse oximeter, strain gauges for thoraco-abdominal movements, one electrocardiography (ECG) lead, a nasal airflow (pressure cannula), and a digital microphone to detect snoring. Polysomnography recordings were scored in 30-s epochs for sleep, breathing and oxygenation according to the standard criteria published by the American Academy of Sleep Medicine (AASM).18 Obstructive apneas were defined as complete cessation of oro-nasal airflow for at least 10s in the presence of chest-wall motion. Hypopneas were defined as 30% or higher reduction in respiratory airflow with 4% or higher arterial oxygen desaturation or 50% or higher reduction in respiratory airflow with 3% or higher arterial oxygen desaturation or an arousal with any of the above for at least 10s. AHI was calculated based on the total number of apneas and hypopneas per hour of sleep.22
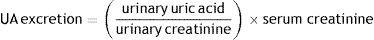
Calculation of UA excretion and overnight change in the UA/creatinine ratio (ΔUA/Cr)Two urine samples were obtained from all patients to calculate UA excretion and the ΔUA/Cr ratio. The first urinary sample was obtained before PSG recording at night, and the second after the recording in the morning. The specimens obtained at night were kept at +4°C. Urine samples were analyzed in the morning for uric acid with uricose (enzymatic, calorimetric). Venous blood samples were obtained and analyzed for creatinine (calorimetric) with Jaffle method, BUN with urease (with kinetic method), and sodium with ion selective electrode (ISE) on a multi-parameter analyzer (Olympus AU 640; Olympus Optical, Tokyo, Japan). After 5 year UA excretion was calculated according to the formula in mg/dL unit, for the sample obtained in the morning23:
ΔUA/Cr was calculated with Hasday and Grum's method15:
Pulmonary function testing
Pulmonary Function Testing was performed in the standing position without nose clips (ZAN 100, Flowhandy, Germany).24 Inhaled salbutamol 400μg was administered and the post-bronchodilator measurements were performed after 15min. At least three, up to five forced expiratory maneuvers were performed to obtain three technically satisfactory blows. The highest FVC and FEV1 values were reported.
Statistical analysisData were expressed as frequencies for categorical variables; and as median (IQR) or as mean and standard deviation for continuous variables, where appropriate. Comparisons between groups were tested by chi-square testing for categorical values and One-way Analysis of Variance (ANOVA) test for continuous variables. Significant factors in the ANOVA test were analyzed in the pairwise comparisons after Bonferroni correction. Fisher's exact test was used for the comparison of categorical variables, when 25% or more of the expected cell counts were below 5. The univariate correlation between UA metabolites (UA excretion and ΔUA/Cr) and PSG findings were assessed with Spearman correlation coefficients. Multiple linear regression analysis was used to assess the independent correlation between UA metabolites and PSG findings, after the adjustment for age, gender and the factors related to UA metabolites in the univariate analysis. Regression coefficients (beta) and 95% CIs were reported. Normality distribution of UA metabolites was tested by Kolmogorov–Smirnov test. For ΔUA/Cr values, exclusion of an outlier provided the normal distribution in the linear regression analysis. Change in UA metabolites after 5 years was analyzed by Wilcoxon Signed Ranks test. The correlation between mortality and baseline UA metabolites was tested by using Mann–Whitney U test. A two-sided p value less than 0.05 was considered to be statistically significant in all comparisons. SPSS 11.0 program was used for the statistical analysis.
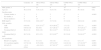
ResultsPatient demographicsPatients were divided into four treatment groups and one control group: 15 patients with nocturnal hypoxemia (NH)-COPD, 15 patients with nocturnal normoxemic (NN)-COPD, 16 patients with NN-OSAS, 15 patients with NH-OSAS, and 14 control subjects. Of the 75 study subjects, 54 were male (72%). There were 21 current smokers and 21 ex-smokers. Characteristics of the disease groups and PSG findings are shown in Table 1. Differences according to gender, age, smoking status and BMI, AHI, T90%, UA excretion and ΔUA/Cr were found to be statistically significant among the patient groups.
Characteristics and polysomnography findings of the disease groups.
| Control(n: 15) | OSAS-NN(n: 16) | OSAS-NH(n: 15) | COPD-NN(n: 15) | COPD-NH(n: 15) | p | |
|---|---|---|---|---|---|---|
| Male gender, n | 6 | 13 | 8 | 14* | 13 | 0.007 |
| Age (yr) | 46.2 (13.0) | 51.6 (12.5) | 52.8 (7.6) | 58.0 (13.3) | 58.1 (6.8) | 0.02 |
| Smoking status | ||||||
| Current smoker, n | 3 | 3 | 5 | 6* | 4 | <0.001 |
| Ex-smoker, n | 3 | 0 | 1 | 9 | 8 | |
| Never smoked, n | 8 | 13 | 9 | 0 | 3 | |
| BMI (kg/m2) | 27.5 (3.6) | 29.6 (2.9)** | 33.7 (5.8) | 27.2 (3.0) | 30.6 (4.8) | <0.001 |
| PSG variables | ||||||
| AHI | 0.6 (0.9) | 22.4 (15.1)** | 62.4 (26.9)*** | 1.3 (1.2) | 2.6 (1.3) | <0.001 |
| T90% | 0.04 (0.13) | 0.8 (0.8) | 42.7 (26.4)*** | 2.8 (2.0) | 35.5 (24.3)*** | <0.001 |
| Nocturnal SaO2% mean | 96.4 (1.4) | 94.8 (1.0) | 88.1 (4.2)*** | 93.9 (2.2) | 87.4 (4.5)*** | <0.001 |
| Nocturnal SaO2% nadir | 89.7 (2.8) | 85.3 (3.5) | 65.3 (9.9)*** | 85.2 (3.0) | 74.6 (6.5)*** | <0.001 |
| UA metabolites | ||||||
| Blood UA (mg/dL) | 4.8 (1.2) | 5.3 (1.5) | 5.8 (1.0) | 5.5 (1.1) | 6.3 (1.7)* | 0.059 |
| UA excretion (mg/dL) | 0.37 (0.14) | 0.35 (0.08) | 0.57 (0.25)* | 0.44 (0.14) | 0.71 (0.19)*** | <0.001 |
| ΔUA/Cr % | −11.8 (25.8) | −9.9 (18.3) | 42.7 (61.5)** | −4.8 (13.3) | 22.6 (38.0) | <0.001 |
Means and (SD)s are given in the table, unless otherwise specified.
T90%: percentage of total sleep time with SaO2 <90%.
Pairwise comparisons after Bonferroni correction, with control group as the reference.
PSG: polysomnography, BMI: body mass index, UA: uric acid, OSAS NN: obstructive sleep apnea syndrome nocturnal normoxemic, OSAS-NH: obstructive sleep apnea syndrome nocturnal hypoxemic, COPD-NN: chronic obstructive pulmonary disease nocturnal normoxemic, COPD-NH: chronic obstructive pulmonary disease nocturnal hypoxemic.
UA excretion significantly correlated with age (correlation coefficient: 0.37, p<0.01), BMI (correlation coefficient: 0.28, p<0.05), T90% (correlation coefficient: 0.57, p<0.01), nocturnal mean SaO2 (correlation coefficient: −0.54, p<0.01) and nocturnal SaO2 nadir (correlation coefficient: −0.39, p<0.01). ΔUA/Cr correlated with AHI (correlation coefficient: 0.36, p<0.01), T90% (correlation coefficient: 0.52, p<0.01), nocturnal mean SaO2 (correlation coefficient: −0.39, p<0.01) and nocturnal SaO2 nadir (correlation coefficient: −0.42, p<0.01). Table 2 shows the correlation between UA metabolites and PSG variables.
Correlation between UA metabolites and polysomnography variables.
| UA excretion | ΔUA/Cr | |
|---|---|---|
| Age (yr) | 0.37** | 0.22 |
| BMI (kg/m2) | 0.28* | 0.19 |
| AHI | 0.15 | 0.36** |
| T90% | 0.57** | 0.52** |
| Nocturnal SaO2% mean | −0.54** | −0.39** |
| Nocturnal SaO2% nadir | −0.39** | −0.42** |
Spearman correlation coefficients are provided in the table.
AHI: apnea-hypopnea index, BMI: body mass index, UA: uric acid.
Regression analysis revealed significant correlation between COPD-NH and UA excretion (beta coefficient: 0.28, 95%CI: 0.16–0.40). T90% was significantly correlated with UA excretion in the model that included AHI, age, gender and BMI (beta coefficient: 0.005, 95%CI: 0.003–0.007). AHI was not significantly associated with UA excretion in the model. The correlation between UA excretion and disease groups, and PSG findings adjusted for age, gender and BMI are shown in Table 3.
Association of uric acid excretion (mg/dL) with disease groups and polysomnography findings adjusted for age, gender and body mass index.
| Beta (95% CI) | R2 | |
|---|---|---|
| Disease groups | ||
| Control | Reference | 0.50 |
| OSAS-NN | −0.047 (−0.172 to 0.078) | |
| OSAS-NH | 0.115 (−0.019 to 0.248) | |
| COPD-NN | 0.032 (−0.100 to 0.165) | |
| COPD-NH | 0.270 (0.135 to 0.406) | |
| PSG variablesa | 0.45 | |
| AHI | −0.002 (−0.003 to 0.000) | |
| T90% | 0.005 (0.003 to 0.007) | |
Model included age, gender, body mass index, AHI and T90%.
Significant findings are shown in bold type.
PSG: polysomnography, AHI: apnea-hypopnea index, OSAS NN: obstructive sleep apnea syndrome nocturnal normoxemic, OSAS-NH: obstructive sleep apnea syndrome nocturnal hypoxemic, COPD-NN: chronic obstructive pulmonary disease nocturnal normoxemic, COPD-NH: chronic obstructive pulmonary disease nocturnal hypoxemic.
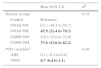
Regression analysis revealed that OSAS-NH and COPD-NH were significantly correlated with ΔUA/Cr (OSAS-NH, beta coefficient: 55.5, 95%CI: 33.7–77.4; COPD-NH, beta coefficient: 43.7, 95%CI: 21.6–65.9). In the model including AHI, age, gender and BMI, T90% displayed significant correlation with ΔUA/Cr (beta coefficient: 0.005, 95%CI: 0.003–0.007). AHI did not significantly correlate with ΔUA/Cr in the model. The correlation between ΔUA/Cr and disease groups, and PSG findings adjusted for age, gender and BMI are shown in Table 4.
Association of ΔUA/Cr % with disease groups and polysomnography findings adjusted for age, gender and BMI.
| Beta (95% CI) | R2 | |
|---|---|---|
| Disease groups | 0.35 | |
| Control | Reference | |
| OSAS-NN | 6.2 (−16.1 to 28.7) | |
| OSAS-NH | 45.9 (21.4 to 70.3) | |
| COPD-NN | 8.9 (−15.0 to 32.9) | |
| COPD-NH | 37.6 (13.0 to 62.2) | |
| PSG variablesa | 0.36 | |
| AHI | 0.1 (−0.1 to 0.4) | |
| T90% | 0.7 (0.4 to 1.1) | |
Model included age, gender BMI, AHI and T90%.
Significant findings are shown in bold type.
PSG: polysomnography, AHI: apnea-hypopnea index, OSAS NN: obstructive sleep apnea syndrome nocturnal normoxemic, OSAS-NH: obstructive sleep apnea syndrome nocturnal hypoxemic, COPD-NN: chronic obstructive pulmonary disease nocturnal normoxemic, COPD-NH: chronic obstructive pulmonary disease nocturnal hypoxemic.
After five year follow-up, 58 subjects could be contacted while 7 could not be contacted, and 10 had deceased (6 in COPD-NH, 3 in COPD-NN and 1 in OSAS-NH group). Of these 58 subjects, 35 provided blood and urine sample for UA measurements (5 each in control, COPD-NN and COPD-NH groups; 9 in OSAS-NN and 11 in OSAS-NH group). Of the 24 patients, who were offered NIMV, 11 were using NIMV (0/3 in COPD-NN, 3/3 in COPD-NH, 3/9 in OSAS-NN and 5/11 in OSAS-NH). There was no significant difference in terms of age, gender, BMI, AHI, T90%, UA excretion and ΔUA/Cr between the patients who could be contacted and those who could not be contacted. Eight patients in the baseline assessment and 11 patients in the second assessment had physician-diagnosed hypertension. Uric acid metabolites did not significantly differ between the patients with and without hypertension.
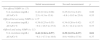
Among the 11 patients, who reported NIMV usage, UA excretion after NIMV was significantly lower than the baseline measurement. There was no significant difference after the 5-year period in the other patients, who did not use NIMV or were not offered NIMV. Table 5 shows the variation in UA metabolites between the baseline measurement and the measurement after 5 years.
Changes in the uric acid metabolites after 5 years.
| Initial measurement | Second measurement | p | |
|---|---|---|---|
| Not offered NIMV (n: 13) | |||
| UA excretion (mg/dL) | 0.42 (0.34 to 0.68) | 0.25 (0.21 to 0.43) | 0.06 |
| ΔUA/Cr % | 2.5 (−8.3 to 15.8) | −8.8 (−19.5 to 25.6) | 0.55 |
| Offered but not using NIMV (n: 11)a | |||
| UA excretion (mg/dL) | 0.38 (0.25 to 0.55) | 0.34 (0.26 to 0.42) | 0.37 |
| ΔUA/Cr % | −9.2 (−28.5 to 27.6) | 21.5 (−14.2 to 42.5) | 0.53 |
| Offered and using NIMV (n: 11) | |||
| UA excretion (mg/dL) | 0.41 (0.36 to 0.57) | 0.29 (0.23 to 0.37) | 0.01 |
| ΔUA/Cr % | −6.1 (−17.3 to 10.6) | 8.9 (−0.68 to 37.8) | 0.37 |
Median and (IQR: interquartile range) are given in the table.
NIMV: noninvasive mechanical ventilation.
Significant findings are shown in bold type.
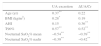
Mortality significantly correlated with baseline UA excretion as shown in Fig. 2. Median and IQR range were 0.79 (0.51–0.89) and 0.41 (0.31–0.55) in the 10 deceased and 58 surviving patients, respectively (p: 0.001). However, mortality did not significantly correlate with ΔUA/Cr which was shown in Fig. 3.


Among the 10 deceased patients, 9 died from respiratory causes, and for 1 patient the cause of death could not be ascertained. Mortality was found to be correlated with age, smoking, T90% and nocturnal mean SaO2. After the adjustment for age, mortality displayed significant correlation with only nocturnal SaO2% mean (OR: 0.82, 95%CI: 0.69–0.97) and UA excretion (OR: 231.0, 95%CI: 3.5–1560.3) (Table 6).
Association between baseline characteristics and mortality in 5 years.
| Alive(n: 58) | Death(n: 10) | p | Adjusted ORa (95%CI) | |
|---|---|---|---|---|
| Male gender, n | 18 | 1 | 0.13 | – |
| Age (yr) | 51 (45 to 60) | 62.5 (58 to 69.2) | 0.001 | – |
| Smoking status | ||||
| Ever smoked, n | 30 | 9 | 0.03 | 9.0 (0.9 to 83.0) |
| Never smoked, n | 28 | 1 | ||
| BMI (kg/m2) | 29.8 (27.0 to 32.4) | 29.5 (23.2 to 30.5) | 0.49 | – |
| PSG variables | ||||
| AHI | 3.9 (0.7 to 30.5) | 1.6 (0.4 to 3.1) | 0.21 | – |
| T90% | 2.4 (0 to 22.7) | 25.0 (3.5 to 60.1) | 0.01 | 1.02 (0.99 to 1.05) |
| Nocturnal SaO2% mean | 94.1 (90.0 to 96.0) | 85.7 (79.2 to 88.2) | 0.001 | 0.82 (0.69 to 0.97) |
| Nocturnal SaO2% nadir | 84.0 (75.7 to 88.2) | 82.0 (70.5 to 84.0) | 0.11 | – |
| UA metabolites | ||||
| Blood UA (mg/dL) | 5.3 (4.7 to 6.2) | 6.0 (5.0 to 9.0) | 0.09 | |
| UA excretion (mg/dL) | 0.41 (0.31 to 0.55) | 0.79 (0.51 to 0.89) | 0.001 | 231.0 (3.5 to 15,060.3) |
| ΔUA/Cr % | −1.0 (−14.1 to 10.7) | 14.0 (−10.3 to 43.4) | 0.16 | |
Median and IQRs are provided in the table unless otherwise specified.
Significant findings are shown in bold type.
PSG: polysomnography, BMI: body mass index, UA: uric acid, AHI: apnea-hypopnea index.
This study, which was conducted in a group of patients including OSA and COPD patients, revealed significant correlation of nocturnal hypoxemia with UA excretion and ΔUA/Cr after the adjustment for potential confounders. Reassessment of patients after 5 years suggested that higher baseline UA excretion had higher mortality. Among those who survived after five years, there was a decrease in UA excretion probably due to PAP treatment. Increased UA excretion in nocturnal hypoxemic OSA patients and significant change in UA excretion after CPAP therapy have been reported.15,25 But to the best of our knowledge, this is one of the few studies which found a correlation between UA excretion and nocturnal hypoxemia in patient groups of OSA and COPD.
Significant differences in ΔUA/Cr were found between hypoxemic and non-hypoxemic patients in previous studies.15,26 These studies, which mostly reported positive ΔUA/Cr values in hypoxemic groups and negative values in non-hypoxemic groups, are similar to ours. However, McKeon et al. did not find significant differences of ΔUA/Cr between hypoxic and non-hypoxic OSAS groups but there was a significant decrease in post-CPAP ΔUA/Cr in the hypoxic group.27 As suggested by McKeon et al., differences between these studies might have arisen from differences in standards for defining hypoxemia and conditions under which the urinary samples were kept.15,26–28 Hasday and Grum classified the patients with minimum SaO2 level below 80% or desaturation score of 20 as the hypoxic group, and kept urinary samples at −20°C.15 In two other studies, patients with SaO2 <90% in minimum 5% of total time or with SaO2 <90% for one hour or with SaO2 <85% for minimum 15min were included in the nocturnal hypoxemic group, and their urinary samples were kept at +4°C with an addition of 5% sodium hydroxide.26–28 In our study, patients who had spent more than 10% of the sleep time with SaO2 <90% were classified as nocturnal hypoxemic, and the urinary samples were kept at +4°C without 5% sodium hydroxide addition. Furthermore, nocturnal hypoxemic patients in our study were likely to be in a more severe condition than those in the previous studies, which could account for the stronger correlations found between UA metabolites and nocturnal hypoxemia in our study.
The correlation between AHI and UA metabolites did not gain significance after the adjustment for nocturnal hypoxemia. Accordingly, the correlation between OSA and UA metabolites might have been mainly due to nocturnal hypoxemia. Other possible explanations include the weak correlation between intermittent hypoxemia in OSA and UA metabolites, and the compensation mechanisms against tissue hypoxia in OSA. Tissue hypoxia is not merely determined with arterial oxygen saturation. Other factors, including cardiac output, hemoglobin, hemoglobin dissociation curve and peripheral circulation, also influence tissue hypoxia. Tissue hypoxia in OSA could be much more regulated by cardiovascular compensation rate than arterial SaO2.28 These mechanisms could be protective against tissue hypoxemia in OSA, which might be an explanation for the scarcity of negative ΔUA/Cr in OSA syndrome patients.
Some of the previous studies suggested that tanometric examination and intramucosal pH measurement were more valid indicators of tissue hypoxia than PaO2 and SaO2.27-29 Arterial lactate, near infrared spectrometry, 2–3 diphosphoglycerate, erythropoietin, monitoring of neural events, positron emission tomography and nuclear magnetic resonance screening are also used to indicate tissue oxygenation. Increased levels of adenosine were reported in respiratory diseases with hypoxemia, but it is difficult and expensive to measure because of its short half-life.27,30 Hypoxanthine and xanthine are unstable intermediate products.5 Among ATP degradation products, UA is chemically stable and excreted by kidneys. Therefore, it is simple and cheap to measure. Our findings could help to enhance the use of UA metabolites as a cost-effective method for detecting tissue hypoxia due to nocturnal hypoxemia in patients with COPD, even in those without daytime hypoxia.
The prognostic value of nocturnal hypoxemia has not been proven for COPD.31–36 In our study, UA excretion was associated with nocturnal hypoxemia. In the reassessment of our patients after 5 years, baseline UA excretion as a marker of tissue hypoxia was found as a predictive factor for mortality in the OSA syndrome and COPD, even in the patients without daytime hypoxemia. We found a correlation between baseline UA excretion and mortality in 5 years. Mortality was mostly the case for the COPD patients, and it was associated with respiratory causes. CPAP usage decreased UA excretion, which suggested a beneficial effect of CPAP therapy on mortality. Because of the limitations of our study, it is hard to suggest UA excretion as a predictive factor for mortality but we consider it to be promising. This hypothesis could be tested in a study including a larger group of patients.
The major limitations of the present study consisted of its small sample size and lack of objective data on the factors that could be associated with mortality over the 5 years and CPAP use. Small sample size of the study was a constraint for adjusting for the potential confounders in the analysis of mortality. The data on characteristics of the patients were provided from the patient files. However, objective criteria were used to define the cases of OSA syndrome and COPD. Control subjects consisted of patients who were admitted to the sleep laboratory with a complaint of snoring. Therefore, they may not represent the general population. Despite the data collected from the patients’ PAP devices, we did not have objective evidence on the use of NIMV or oxygen therapy. However, compliance rate of NIMV was similar to the previous studies in OSAS.37 We excluded patients with conditions that could affect the UA measurements but 5 years constitute a long period of time for a reliable patient statement. Hypertension was the case for approximately 15% of our patients, which could decrease UA excretion. However, the analysis did not reveal a significant difference between hypertensive and normotensive patients.
To sum up, our findings suggest that nocturnal hypoxemia in OSA and COPD patients could lead to comparable levels of tissue hypoxia, which may be one of the main reasons for disease-related morbidity and mortality. Further studies including more patients with nocturnal hypoxemia could establish the relationship between UA excretion and mortality. If validated, such measurements could be used to reach and monitor the high risk patients (“case finding”) who could benefit more from oxygen and CPAP treatment.
Ethical disclosuresProtection of human and animal subjectsThe authors declare that no experiments were performed on humans or animals for this study.
Confidentiality of dataThe authors declare that they have followed the protocols of their work center on the publication of patient data.
Right to privacy and informed consentThe authors have obtained the written informed consent of the patients or subjects mentioned in the article. The corresponding author is in possession of this document.
Conflicts of interestThe authors declared that they have no conflict of interest.


