


There is a lack of evidence regarding the association between the undernutrition risk at hospital admission with adverse clinical outcomes amongst pulmonology inpatients. The aim of this study was to quantify the association between undernutrition risk at hospital admission and time to discharge alive.
MethodsA retrospective cohort study including patients consecutively admitted to a pulmonology unit was conducted. Undernutrition risk at hospital admission was identified using the Malnutrition Universal Screening Tool. Survival analyses (Kaplan–Meier curves and Cox regression) were carried out.
ResultsThe sample was composed of 683 patients. Patients who presented high undernutrition risk on hospital admission had a longer length of hospital stay (approximately 50% were discharged to home after 14 days of hospitalization). In the multivariable Cox regression, high undernutrition risk was shown to be independently associated with a lower probability of discharge alive over time (adjusted hazard ratio=0.70; 95% confidence interval: 0.55–0.90).
ConclusionsPulmonology inpatients with high undernutrition risk have a longer length of hospital stay and had a lower probability of being discharged to home. In particular, lung cancer patients had a lower probability of being discharged to home, which corroborates a worse prognosis for these patients.
A high proportion of pulmonology inpatients are at undernutrition risk or are undernourished despite the increasing awareness of its burden.1–4 Being male,4 older,5 side effects of treatments or drugs as well as eating and swallowing difficulties6 have already been shown to be related to undernutrition risk in hospitalized patients presenting a wide range of diagnoses. However, data regarding the factors associated with undernutrition risk on hospital admission in pulmonology inpatients is still required.
Pulmonology patients, such as chronic obstructive pulmonary disease (COPD) or lung cancer (LC) patients, frequently experienced breathing difficulties that can cause loss of appetite and decreased nutritional intake.7–9 Moreover, the state of inflammation of those patients contributes to body mass depletion,7,8 highlighting pulmonology patients as prone to be at undernutrition risk.
Undernutrition revealed to be associated with a prolonged length of hospital stay (LOS) and increased risk of morbidity and mortality in a varied sample of hospitalized patients.10 It has also been shown, in mixed inpatients samples, that undernutrition contributes to increased costs for health care6,11 and social services provision.12
Among pulmonology patients, undernutrition has been linked to poor prognosis and recurrent hospitalization.2,13–15 However, knowledge regarding the association of undernutrition with increased LOS and worse prognosis in pulmonology department inpatients was obtained from bivariable comparative analysis6,16,17 or logistic regression models,12,15 which did not take into account all the parameters that may be related to LOS and discharge destination. Some studies that included pulmonology patients reported the use of survival analysis. However, patients were all analyzed in a single group without stratified analysis for pulmonology patients10,18 or the analysis was related to a particular group of pulmonary disease patients.2,13,14 In fact, evidence regarding the nutritional factors associated with LOS and discharge destination among pulmonology department inpatients is scarce, which reinforces the need for further research.
Increasing knowledge regarding the consequences of undernutrition among pulmonology patients would be of major relevance. Predicting LOS is relevant for hospital management since it would allow hospitals to organize their resources accordingly. Moreover, it is essential for the development of a more effective health care plan.19 Shortening LOS would also reduce health care costs. Additionally, the early identification of patients’ health status and the implementation of an adequate treatment would reduce the risk of nosocomial infections and could lead to an improvement in patients’ quality of life.20
Several tools have been developed to assess undernutrition risk. Nonetheless, there is current knowledge that undernutrition screening tools differ in their performance,21 and there is no gold standard defined for identification of undernutrition risk17 and no consensus about the most appropriate tool for undernutrition screening neither for hospitalized patients nor specifically for pulmonology inpatients. Actually, a recent systematic review and meta-analysis has revealed a lack of standardized methods to assess undernutrition risk and undernutrition in pulmonology inpatients.22
The Malnutrition Universal Screening Tool (MUST) was developed by the British Association for Parenteral and Enteral Nutrition and was validated in a hospital setting.23,24
Therefore, this study aimed to quantify the association of undernutrition risk evaluated using the MUST at hospital admission with time to discharge alive.
MethodsStudy design and participantsA retrospective cohort study was performed in the Pulmonology Department of the “Centro Hospitalar Vila Nova de Gaia/Espinho”. Patients over eighteen years of age who were consecutively admitted to this department between February 2013 and May 2014 were considered for inclusion in the study. Information on patients’ eligibility was gathered from clinical files.
The exclusion criteria were the absence of information about undernutrition risk evaluation due to discharge or death before the evaluation (n=106), the incapacity of the patient to provide information (n=6) or the unavailability of perform undernutrition risk evaluation in isolated patients due to an infectious condition (n=4).
Given the high number of hospital readmissions, the first admission during the study period was considered for this study, except for cases where information regarding undernutrition risk evaluation was missing. The follow-up period corresponded to the LOS, which is the number of days from hospital admission until the end of the hospital stay.
The study protocol was approved by the Hospital Ethical Committee (number 35/2015) and by the Institution Administration Board (number 3859;49/2015). All information was obtained according to the recommendations of the Declaration of Helsinki.
Data collectionData on socio-demographic characteristics (sex, age, marital status and working status), on clinical characteristics (diagnosis, LOS and discharge destination) and on undernutrition risk evaluation were obtained from the patient's clinical file.
Socio-demographic and other clinical parametersMarital status was defined as married (married or civil partnership), single, widowed or divorced. Working status was categorized as (1) employed, (2) unemployed or economically inactive, (3) retired and (4) housewives and students.
The diagnoses presented by the patients at hospital admission were categorized into nine categories: LC, asthma, pneumonia, pneumothorax, tuberculosis, COPD, empyema, bronchiectasis and “other reasons”. In diagnoses such as COPD and LC, the patients were also categorized by their histological type and stage, and only by stage in COPD patients, whenever this information was available.
The discharge destination was considered as “discharged to home”, “transferred to continuing care unit”, “transferred to another hospital”, “discharge against medical advice” or “death”.
Undernutrition risk evaluationIn the department under study, patient's undernutrition risk was assessed using MUST, which is applied in the first 72h after hospital admission,23,25 as a established procedure. MUST has shown good validity,24,26 is quick and easy to apply and has an excellent reproducibility between users.24 The MUST overall undernutrition risk final score corresponds to the sum of the scores obtained in each parameter, ranking the patients into low (0), moderate (1) or high undernutrition risk (≥2).
Anthropometric data (height and weight) was collected applying standard procedures,27 using a Seca® scale with an incorporated stadiometer. When it was impossible to obtain these parameters, reported weight and height or mid-upper arm circumference was used as an alternative to estimate body mass index, as recommended.23 The percentage of weight loss, used to calculate the final score of the MUST, was calculated considering the weight registered in the medical records or the weight reported by the patient.23 The undernutrition risk evaluation was performed by trained nutritionists, which contribute to intra and inter-interviewer agreement.
Data analysisCategorical variables were described as absolute and relative frequencies. Continuous variables were described as mean and standard deviation (SD) if normal distributed or as median and interquartile range (IQR) if distributed different from normal. Proportions were compared using Chi-square test. Continuous variables were compared across categories of undernutrition risk using ANOVA or Kruskal–Wallis test, as appropriate.
Survival analysis was also conducted, and the Kaplan–Meier method was used to estimate the cumulative probability of being discharged alive over time, according to undernutrition risk at hospital admission and diagnosis. Patients who were transferred to another hospital or to a continuing care unit (n=16), those who died during hospitalization (n=62) or those who were discharged against medical advice (n=7) were censored at the time of those events. LOS was censored at 30 days28 (n=48). A higher probability of discharge-free survival represents a lower probability of hospital discharge at a certain time.
Cox proportional hazard regression models were fitted to estimate the hazard ratios (HR) and respective 95% confidence intervals (CI). Akaike Information Criterion was used to evaluate the fit of the model. In the multivariable Cox proportional hazard regression the following variables were considered: sex, age (continuous), undernutrition risk (categorical: low, moderate and high undernutrition risk), marital status (married vs. not married (including single, widowed and divorced)), working status (employed, unemployed (including both categories of unemployed and housewives and students) and retired) and diagnosis (categorical: LC, COPD, pneumonia, bronchiectasis and other diagnoses).
Statistical analysis was carried out using SPSS (version 23.0; IBM-SPSS, Inc.). The adopted significance level was 5%.
ResultsThis sample was composed of 683 patients, of which the majority were men (67.2%) with a mean (SD) age of 63.2 (16.3) years. Among the studied sample, 16.5% and 18.3% of the patients presented moderate and high undernutrition risk, respectively (34.8% of undernutrition risk).
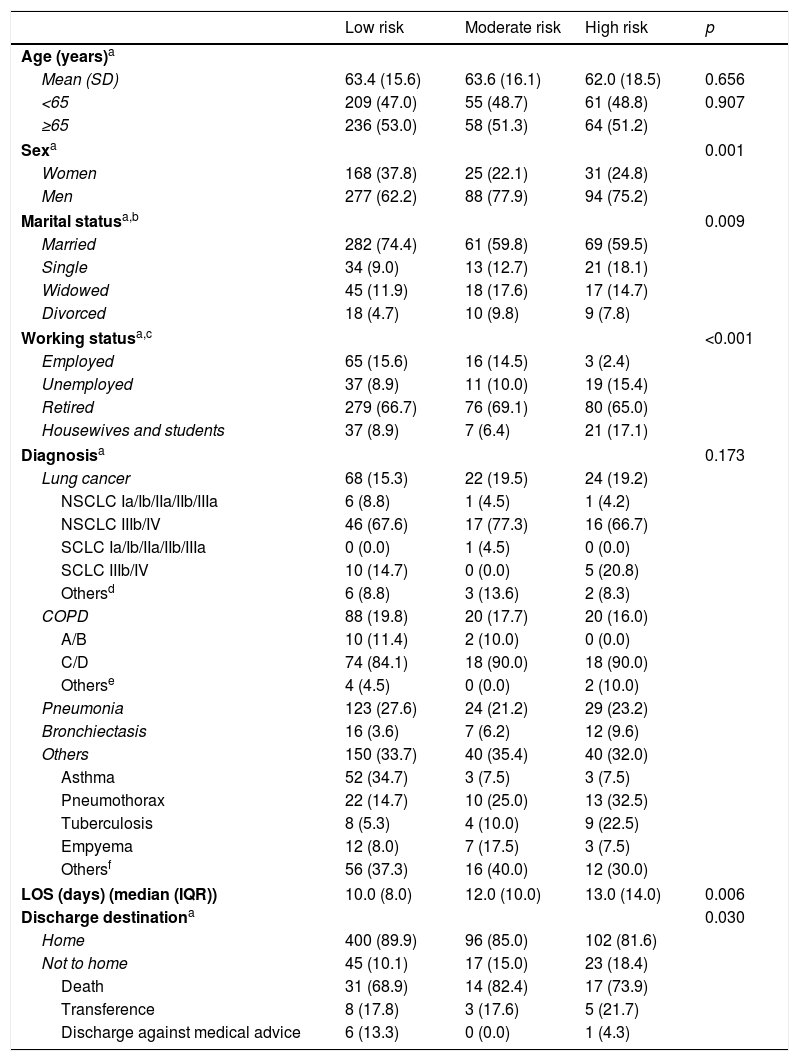
A higher proportion of men were observed among moderate and high undernutrition risk categories (p=0.001). Across the gradient of undernutrition risk (low to high undernutrition risk), there was a decrease in the proportion of married participants and an increase of the proportion of single individuals (p=0.009). Also, an increase in the proportion of unemployed individuals was observed in the high undernutrition risk category (p<0.001) (Table 1).
Sample characterization according to undernutrition risk categories on hospital admission.
| Low risk | Moderate risk | High risk | p | |
|---|---|---|---|---|
| Age (years)a | ||||
| Mean (SD) | 63.4 (15.6) | 63.6 (16.1) | 62.0 (18.5) | 0.656 |
| <65 | 209 (47.0) | 55 (48.7) | 61 (48.8) | 0.907 |
| ≥65 | 236 (53.0) | 58 (51.3) | 64 (51.2) | |
| Sexa | 0.001 | |||
| Women | 168 (37.8) | 25 (22.1) | 31 (24.8) | |
| Men | 277 (62.2) | 88 (77.9) | 94 (75.2) | |
| Marital statusa,b | 0.009 | |||
| Married | 282 (74.4) | 61 (59.8) | 69 (59.5) | |
| Single | 34 (9.0) | 13 (12.7) | 21 (18.1) | |
| Widowed | 45 (11.9) | 18 (17.6) | 17 (14.7) | |
| Divorced | 18 (4.7) | 10 (9.8) | 9 (7.8) | |
| Working statusa,c | <0.001 | |||
| Employed | 65 (15.6) | 16 (14.5) | 3 (2.4) | |
| Unemployed | 37 (8.9) | 11 (10.0) | 19 (15.4) | |
| Retired | 279 (66.7) | 76 (69.1) | 80 (65.0) | |
| Housewives and students | 37 (8.9) | 7 (6.4) | 21 (17.1) | |
| Diagnosisa | 0.173 | |||
| Lung cancer | 68 (15.3) | 22 (19.5) | 24 (19.2) | |
| NSCLC Ia/Ib/IIa/IIb/IIIa | 6 (8.8) | 1 (4.5) | 1 (4.2) | |
| NSCLC IIIb/IV | 46 (67.6) | 17 (77.3) | 16 (66.7) | |
| SCLC Ia/Ib/IIa/IIb/IIIa | 0 (0.0) | 1 (4.5) | 0 (0.0) | |
| SCLC IIIb/IV | 10 (14.7) | 0 (0.0) | 5 (20.8) | |
| Othersd | 6 (8.8) | 3 (13.6) | 2 (8.3) | |
| COPD | 88 (19.8) | 20 (17.7) | 20 (16.0) | |
| A/B | 10 (11.4) | 2 (10.0) | 0 (0.0) | |
| C/D | 74 (84.1) | 18 (90.0) | 18 (90.0) | |
| Otherse | 4 (4.5) | 0 (0.0) | 2 (10.0) | |
| Pneumonia | 123 (27.6) | 24 (21.2) | 29 (23.2) | |
| Bronchiectasis | 16 (3.6) | 7 (6.2) | 12 (9.6) | |
| Others | 150 (33.7) | 40 (35.4) | 40 (32.0) | |
| Asthma | 52 (34.7) | 3 (7.5) | 3 (7.5) | |
| Pneumothorax | 22 (14.7) | 10 (25.0) | 13 (32.5) | |
| Tuberculosis | 8 (5.3) | 4 (10.0) | 9 (22.5) | |
| Empyema | 12 (8.0) | 7 (17.5) | 3 (7.5) | |
| Othersf | 56 (37.3) | 16 (40.0) | 12 (30.0) | |
| LOS (days) (median (IQR)) | 10.0 (8.0) | 12.0 (10.0) | 13.0 (14.0) | 0.006 |
| Discharge destinationa | 0.030 | |||
| Home | 400 (89.9) | 96 (85.0) | 102 (81.6) | |
| Not to home | 45 (10.1) | 17 (15.0) | 23 (18.4) | |
| Death | 31 (68.9) | 14 (82.4) | 17 (73.9) | |
| Transference | 8 (17.8) | 3 (17.6) | 5 (21.7) | |
| Discharge against medical advice | 6 (13.3) | 0 (0.0) | 1 (4.3) | |
BMI: body mass index; CI: confidence interval; COPD: chronic obstructive pulmonary disease; IQR: interquartile range; LOS: length of hospital stay; MUST: Malnutrition Universal Screening Tool; NSCLC: non-small cell lung cancer; OR: odds ratio; SCLC: small cell lung cancer; SD: standard deviation.
Pulmonary mass without confirmation of diagnosis (n=2), sarcomatoid carcinoma (n=1), sarcoma (n=1), large cells carcinoma (n=1), carcinoma without staging (n=2), non-Hodgkin's lymphoma (n=1), lung carcinoma (n=1), malignant mesothelioma (n=1), large cell neuroendocrine carcinoma (n=1).
Respiratory failure (n=25), haemoptysis (n=11), tracheobronchitis (n=10), pulmonary embolism (n=9), bronchitis (n=4), respiratory infection (n=3), pleural effusion (n=5), bronchospasm (n=4), pulmonary fibrosis (n=2), pulmonary hypertension (n=2), pulmonary silicosis (n=2), sarcoidosis (n=1), bronchospasm resistant to therapy (n=1), splenic biopsy (n=1), tracheal stenosis (n=1), alveolar proteinosis (n=1), respiratory acidosis (n=1), pulmonary aspergillosis (n=1).
There are significant differences concerning LOS and discharge destination according to undernutrition risk categories. Patients with high undernutrition risk had longer LOS (p=0.006) and among those, it was verified a higher proportion of patients who were not discharged to home (p=0.030), compared with the other groups.
In the survival analysis, we observed that patients with high undernutrition risk on admission had higher probability of remaining in the hospital at a certain point in time (p<0.001; Fig. 1a). Similarly, LC patients had lower probability of hospital discharge (p<0.001). Kaplan–Meier curves for COPD, pneumonia, bronchiectasis and other diagnoses seemed to be overlapped (Fig. 1b). Patients with high undernutrition risk had a longer LOS, with approximately 50% of patients discharged to home only after 14 days of hospitalization (p<0.001; Fig. 1a). On the other hand, patients with low and moderate undernutrition risk were discharged to home after a median of 10 and 13 days, respectively.
 and diagnosis (b). Higher values of discharge-free survival represent a lower probability of hospital discharge at a certain time point; in-hospital deaths, transfers and discharge against medical advice were censored at time of those events. Length of hospital stay was censored at 30 days.")
Kaplan–Meier estimates of discharge-free survival of pulmonology inpatients according to undernutrition risk (a) and diagnosis (b). Higher values of discharge-free survival represent a lower probability of hospital discharge at a certain time point; in-hospital deaths, transfers and discharge against medical advice were censored at time of those events. Length of hospital stay was censored at 30 days.
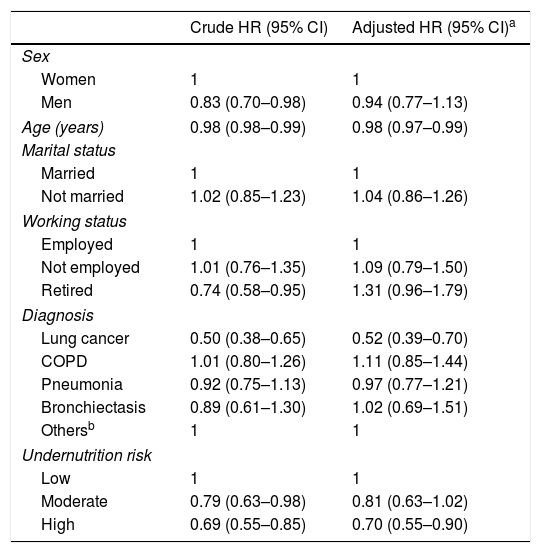
Through Cox regression, we verified that the presence of high undernutrition risk at hospital admission was associated with a decreasing probability of discharge alive over time, regardless of sex, age, diagnosis, marital status and working status (adjusted HR=0.70; 95% CI: 0.55–0.90) (Table 2). Lung cancer patients were also shown to have a lower probability of being discharged to home.
Undernutrition risk identified by Malnutrition Universal Screening Tool and discharge over time.
| Crude HR (95% CI) | Adjusted HR (95% CI)a | |
|---|---|---|
| Sex | ||
| Women | 1 | 1 |
| Men | 0.83 (0.70–0.98) | 0.94 (0.77–1.13) |
| Age (years) | 0.98 (0.98–0.99) | 0.98 (0.97–0.99) |
| Marital status | ||
| Married | 1 | 1 |
| Not married | 1.02 (0.85–1.23) | 1.04 (0.86–1.26) |
| Working status | ||
| Employed | 1 | 1 |
| Not employed | 1.01 (0.76–1.35) | 1.09 (0.79–1.50) |
| Retired | 0.74 (0.58–0.95) | 1.31 (0.96–1.79) |
| Diagnosis | ||
| Lung cancer | 0.50 (0.38–0.65) | 0.52 (0.39–0.70) |
| COPD | 1.01 (0.80–1.26) | 1.11 (0.85–1.44) |
| Pneumonia | 0.92 (0.75–1.13) | 0.97 (0.77–1.21) |
| Bronchiectasis | 0.89 (0.61–1.30) | 1.02 (0.69–1.51) |
| Othersb | 1 | 1 |
| Undernutrition risk | ||
| Low | 1 | 1 |
| Moderate | 0.79 (0.63–0.98) | 0.81 (0.63–1.02) |
| High | 0.69 (0.55–0.85) | 0.70 (0.55–0.90) |
CI: confidence interval; COPD: chronic obstructive pulmonary disease; HR: hazard ratio.
Adjusted by sex, age (continuous), undernutrition risk, marital status, working status and diagnosis.
Asthma, pneumothorax, tuberculosis, empyema, others (respiratory failure, haemoptysis, tracheobronchitis, pulmonary embolism, bronchitis, respiratory infection, pleural effusion, bronchospasm, pulmonary fibrosis, pulmonary hypertension, pulmonary silicosis, sarcoidosis, bronchospasm resistant to therapy, splenic biopsy, tracheal stenosis, alveolar proteinosis, respiratory acidosis, pulmonary aspergillosis).
In the present study, approximately one in three patients admitted to this pulmonology department was at undernutrition risk. Our results revealed that undernutrition risk assessed by MUST is associated with both LOS and discharge destination among pulmonology inpatients.
The prevalence of undernutrition risk found in the present analysis is similar to previous results (33.8%) of inpatients from the same department where this study has been conducted.29 However, higher frequencies have also been reported in other settings.4,30 A recent study conducted in Norway among respiratory diseases patients using the Nutritional Risk Screening—2002 (NRS-2002) showed a higher prevalence of undernutrition risk (43.5%).30 In another study carried out in a Chinese pulmonology unit, also using NRS-2002, 55.9% of patients were at undernutrition risk.4 These results reveal a high, although variable, prevalence of undernutrition risk among these patients across different settings, geographical areas and using different undernutrition screening tools. Similarly to a recent systematic review, MUST revealed to have good predictive validity for both LOS and mortality among adult inpatients.21
According to our results, the probability of discharge alive over time decreased with the presence of high undernutrition risk on admission. This is in agreement with previous studies, involving inpatients from a wide variety of medical wards31 and pulmonology inpatients.2,10,13,18 The association of undernutrition with in-hospital mortality was reported among acute care patients with respiratory diseases.10 Survival analyses, performed among tuberculosis patients2,13 using either MUST or Malnutrition Screening Tool, revealed that patients with high undernutrition risk had a lower probability of survival. This reinforces our findings, since a lower probability of being discharged to home among patients at high undernutrition risk was found.
Furthermore, through Cox analysis, it was shown that high undernutrition risk maintained its association with time to discharge, even after adjusting for sex, age, marital status, working status and diagnosis. LC patients were less likely to be discharged alive over time. These findings are similar to those previously reported in non-small cell LC outpatients, in whom the presence of undernutrition was associated with lower overall survival.14
This is a relevant study on the association of undernutrition risk with adverse clinical outcomes amongst pulmonology department inpatients. To the best of our knowledge, evidence in pulmonology inpatients is scarce and it has been mainly focused on specific patients groups and the use of different screening tools makes it difficult to make comparisons. In the majority of studies survival analysis was not carried out,6,12,15–17 and its use can be regarded as a study strength.
The concurrent validity of MUST at hospital level was previously studied.24 MUST was shown to be a reliable and useful tool for predicting adverse outcomes in tuberculosis patients13 and also in line with results from inpatients from a wide spectrum of medical wards.26,31–33
This study aimed to evaluate the association between the nutritional parameters assessed on hospital admission and time to discharge alive.
As patients with increased disease severity would certainly be those with the greatest need of hospitalization34 and as the undernutrition risk increases with disease severity,35 the inclusion of this information would be valuable for forthcoming studies, since it was unavailable for the present study. Furthermore, education level would be relevant for socio-demographic characterization36 and because this information was unavailable, the possibility of confounding cannot be discarded as it was reported that less educated patients are more likely to be undernourished.37 It is noteworthy that in some cases information on weight was reported by patients; thus, our results could be influenced by recall bias.
Additionally, selection bias could occur since patients were selected from a tertiary hospital. Nonetheless, our findings could be generalized to pulmonology inpatients with identical characteristics as those included in this study.
The major strengths of this study were the evaluation of a large and varied sample of patients from a pulmonology department and from the same geographical area, allowing the generalizability of these results for patients with similar characteristics.
The findings of this study support the need of early nutritional screening and assessment and consequently implementation of nutritional support. Further studies are still required to study specific diagnoses in order to improve nutritional status of hospitalized patients. In our study we only used data on undernutrition screening, thus it will be also relevant to use data on the diagnosis of undernutrition in future studies.
ConclusionsThis study reveals that patients at high undernutrition risk have longer LOS and a lower probability of being discharged to home, regardless of sex, age, marital status, working status and diagnosis. Lung cancer patients had lower probability of being discharged to home, which corroborates a worse prognosis for these patients. Hospitals should follow the guidelines for nutritional screening and assessment as early nutritional interventions can improve nutritional status and therefore improve clinical outcomes.
Conflicts of interestThe authors have no conflicts of interest to declare.


