


Obstructive sleep apnea (OSA) is a prevalent sleep condition which is very heterogeneous although not formally characterized as such, resulting in missed or delayed diagnosis. Cluster analysis has been used in different clinical domains, particularly within sleep disorders. We aim to understand OSA heterogeneity and provide a variety of cluster visualizations to communicate the information clearly and efficiently.
Materials and MethodsWe applied an extension of k-means to be used in categorical variables: k-modes, to identify OSA patients’ groups, based on demographic, physical examination, clinical history, and comorbidities characterization variables (n = 40) obtained from a derivation and validation cohorts (211 and 53, respectively) from the northern region of Portugal. Missing values were imputed with k-nearest neighbours (k-NN) and a chi-square test was held for feature selection.
ResultsThirteen variables were inserted in phenotypes, resulting in the following three clusters: Cluster 1, middle-aged males reporting witnessed apneas and high alcohol consumption before sleep; Cluster 2, middle-aged women with increased neck circumference (NC), non-repairing sleep and morning headaches; and Cluster 3, obese elderly males with increased NC, witnessed apneas and alcohol consumption. Patients from the validation cohort assigned to different clusters showed similar proportions when compared with the derivation cohort, for mild (C1: 56 vs 75%, P = 0.230; C2: 61 vs 75%, P = 0.128; C3: 45 vs 48%, P = 0.831), moderate (C1: 24 vs 25%; C2: 20 vs 25%; C3: 25 vs 19%) and severe (C1: 20 vs 0%; C2: 18 vs 0%; C3: 29 vs 33%) levels. Therefore, the allocation supported the validation of the obtained clusters.
ConclusionsOur findings suggest different OSA patients’ groups, creating the need to rethink these patients’ stereotypical baseline characteristics.
Obstructive sleep apnea (OSA) is a common sleep disorder characterized by recurrent episodes of collapse of the upper airway during sleep, which is estimated to occur in nearly 1 billion adults aged 30–69 years worldwide and in more than 5 million in Portugal.1 Although commonly observed in clinical practice, OSA which is a heterogeneous condition with various predisposing factors, pathophysiological mechanisms, clinical manifestations and consequences of respiratory events; has not been formally characterized, posing critical challenges to its clinical recognition and resulting in missed or delayed diagnosis.2 A diagnosis is established when a patient has an apnea-hypopnea index (AHI) ≥5 with associated symptoms or an AHI ≥15 regardless of associated symptoms.3 Nevertheless, it has long been recognized that AHI alone does not capture OSA's patients’ heterogeneity, that one-size does not fit all.4 The review of Zinchuk et al., presents numerous studies that used analytic approaches to gain advantage of this heterogeneity.4 In addition, Allan Pack studies discuss P4 medicine and how it might be applicable to OSA, specifically if OSA diagnosis or treatment were personalized, providing several examples of this personalized, predictive, preventative and participatory medicine.5 Cluster analysis, a hypothesis-generating strategy (or unsupervised learning), is being used to identify subtypes of patients with unique characteristics, classifying patients with OSA into smaller and more homogeneous disorder phenotypes. This is a statistical approach that studies the relationships present among groups of participants or variables in a population, aiming at the benefit of allowing more specific diagnosis and treatment strategies. This is accomplished by assessing similarity (or dissimilarity) between subjects using metrics such as correlation or distance based on the features used to characterize each individual. Ideally, each cluster member is as similar as possible to each other and as different as possible from those in other clusters. One approach in cluster analysis is the k-modes algorithm.6 This algorithm extends the k-means paradigm to cluster categorical data by using a simple matching dissimilarity measure for categorical objects, modes instead of means for clustering, and a frequency-based method to update modes in the k-means fashion clustering process.7 The dissimilarity measure can be defined by the total mismatches of the two objects’ corresponding variable categories: the smaller the number of mismatches, the more similar the two objects are. To better understand OSA heterogeneity, this study applies categorical cluster analysis to various observable and measurable OSA characteristics, such as signs, symptoms, demographics, and comorbidities. It also provides a variety of cluster visualizations to communicate this information clearly and efficiently.
Material and methodsA literature review was previously conducted to identify the most relevant OSA variables to be collected from the medical records and a total of 51 variables were noted, such as: demographic variables (e.g., gender); physical examination (e.g., body mass index (BMI)); clinical history (e.g., snoring); and comorbidities (e.g., stroke).
Derivation cohortAll patients who underwent polysomnography (PSG) at the Vila Nova de Gaia and Espinho Hospital Center Sleep Laboratory were included in the study. All administrative records were collected retrospectively between January and May 2015; patients included were aged above 18 years old and were suspected of having OSA. Patients already diagnosed with OSA or with severe lung diseases or neurological conditions and pregnant women were excluded. In the case of duplicate exams, the one with better sleep efficiency was selected.8 This study was approved by the Ethics Commission of Vila Nova de Gaia and Espinho Hospital Center, in accordance with the Declaration of Helsinki.
Validation cohortWe have prospectively included adult patients suspected of having OSA referred to perform PSG at the Sleep Laboratory of São João University Hospital, between December 2019 and March 2020, following the previously mentioned inclusion and exclusion criteria. This study was approved by the Ethics Commission of São João University Hospital, in accordance with the Declaration of Helsinki.
Pre-processing phaseAlthough we had access to all the electronic medical records from the included patients, after screening all unstructured text reports, some predictive variables were not fully present or described, as physicians normally do not mention the absence of a disease, or it could only be noted in paper records (missing data proportions ranged from 0% for gender to 97% for bariatric surgery). Variables with more than 80% missing values were removed from the analysis (e.g., decreased libido). Also, daytime sleepiness exhibited contradictory results (higher percentage of patients in the normal group n = 77; 72%) with statistical significance. This was also described for the Epworth Sleepiness Scale (ESS), which presented a contradiction to the literature and the inherent meaning of the variables, and thus was not considered for statistical analysis. For more details, please refer to supplementary file (A). The outcome measure was OSA clinical diagnosis (AHI≥5 plus excessive daytime sleepiness and at least two of the following three criteria: habitual loud snoring; witnessed apnea or gasping or choking; or diagnosed hypertension) obtained from PSG.9
We performed a pre-processing analysis, and continuous variables were categorized, plus k-nearest neighbours (k-NN) imputation was conducted to preserve all cases with missing data being replaced with a value obtained from related cases from the complete set of records.10 After chi-square analysis, variables were selected if presenting a significant univariate association with the outcome (AHI), considering a 5% significance level. We used R software11 to perform descriptive and associative analysis (packages gmodels12 and epitools13), the k-modes categorical clustering (package klaR14) and to create standard barplot (ggplot215), heatmap (gplots16) and radar chart (fmsb17).
ResultsDerivation cohortIn total, 211 patients were diagnosed with OSA (66%), of which 115 (55%) were categorized as mild, 50 (24%) as moderate and 46 (22%) as severe. Seventy percent were males with a mean age of 61 (53–68) years old and with OSA. The lower age category, 20–44 years old, had a lower percentage of patients with OSA, oppositely to categories 45–64 and 65–90 (P<0.001). Looking only at OSA patients, neck (NC) and abdominal circumference (AC) had a mean of 42 (39–44) cm and 107 (100- 113) cm, and a BMI median value of 30 (27–30) Kg/m2 (P = 0.008). Several variables had no statistical significance but had a higher number of patients in the OSA group, namely craniofacial and upper airway abnormalities (CFA), snoring, nocturia, sleep fragmentation, insomnia, drivers, family history, myocardial infarction, arterial hypertension, pacemaker, stroke, renal failure, dyslipidaemia, and hypothyroidism. In contrast, a higher percentage of normal patients were seen in gasping/choking, behavioural changes, decreased libido, vehicle crashes, coffee, use of sedatives, respiratory alterations, and anxiety/depression.
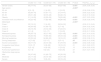
A total of 13 variables were incorporated into the cluster analysis: gender, age, BMI, NC, modified Mallampati, witnessed apneas, nonrepairing sleep, morning headaches, driving sleepiness, alcohol consumption, congestive heart failure, arrhythmias, and pulmonary hypertension, resulting in three distinct clusters, presented in Table 1. Figure 1, 2 and 3 visually synthesizes the information obtained from Clusters 1 to 3.
Clinical characteristics of the obstructive sleep apnea cohort by the defined clusters, % [95%CI].
| Cluster 1(n = 112) | Cluster 2(n = 44) | Cluster 3(n = 55) | P value | P(C|F)(c1, c2, c3) | |
|---|---|---|---|---|---|
| Gender (male) | 85 [77–91] | 20 [10–36] | 80 [67–89] | <0.001 | (0.64, 0.06, 0.30) |
| Age (years) | <0.001* | ||||
| 20–44 | 6 [3–13] | 11 [4–25] | 11 [5–23] | (0.39, 0.28, 0.33) | |
| 45–64 | 65 [56–74] | 57 [41–71] | 27 [14–41] | (0.65, 0.22, 0.33) | |
| 65–90 | 29 [21–38] | 32 [19–48] | 62 [48–74] | (0.40, 0.18, 0.42) | |
| Obesity | 21 [14–29] | 43 [29–59] | 76 [63–86] | <0.001 | (0.27, 0.23, 0.50) |
| Increased neck circumference | 30 [22–40] | 77 [62–88] | 96 [86–99] | <0.001 | (0.28, 0.28, 0.44) |
| Mallampati | <0.001* | ||||
| Class I | 22 [15–31] | 11 [4–25] | 36 [24–50] | (0.50, 0.10, 0.40) | |
| Class II | 48 [39–58] | 61 [46–75] | 5 [1–16] | (0.64, 0.32, 0.04) | |
| Class III | 26 [18–35] | 23 [12–38] | 47 [34–61] | (0.45, 0.15, 0.40) | |
| Class IV | 4 [1–9] | 5 [1–17] | 11 [5–23] | (0.33, 0.17, 0.50) | |
| Witnessed apneas | 64 [55–73] | 30 [17–45] | 75 [61–85] | <0.001 | (0.57, 0.10, 0.33) |
| Nonrepairing sleep | 46 [36–55] | 70 [55–83] | 29 [18–43] | <0.001 | (0.52, 0.32, 0.16) |
| Morning headaches | 45 [35–54] | 84 [69–93] | 18 [10–31] | <0.001 | (0.52, 0.38, 0.10) |
| Driving sleepiness | 13 [7–20] | 5 [1–17] | 2 [0–11] | .05 | (0.82, 0.12, 0.06) |
| Alcohol consumption | 85 [77–91] | 20 [10–36] | 91 [79–97] | <0.001 | (0.62, 0.06, 0.32) |
| Congestive heart failure | 10 [5–17] | 14 [6–28] | 18 [10–31] | .31 | (0.41, 0.22, 0.37) |
| Arrhythmias | 5 [2–12] | 14 [6–28] | 11 [5–23] | .15 | (0.34, 0.33, 0.33) |
| Pulmonary hypertension | 4 [1–9] | 9 [3–23] | 13 [6–25] | .07 | (0.27, 0.27, 0.46) |
| Obstructive sleep apnea | .50 | ||||
| Mild | 56 [47–66] | 61 [46–75] | 45 [32–59] | ||
| Moderate | 24 [17–33] | 20 [10–36] | 25 [15–39] | ||
| Severe | 20 [13–28] | 18 [9–33] | 29 [18–43] |


Cluster 1 weighted the least and had non-increased neck circumference in middle-aged males. It had a higher percentage of driving sleepiness, and lower percentages in congestive heart failure, arrhythmias, pulmonary hypertension and modified Mallampati. In addition, it had the second higher percentage of witnessed apneas, nonrepairing sleep, morning headaches, and alcohol consumption. The mild severity level had a higher value. Cluster 2 was mainly middle-aged women with increased NC. It had the lowest percentage of witnessed apneas and alcohol consumption, and very low percentages of comorbidities. Finally, Cluster 3 presented older and obese men with increased NC. Witnessed apneas were reported in 75% of the patients, and alcohol consumption, congestive heart failure, and pulmonary hypertension had the highest percentages in all the clusters. In contrast, nonrepairing sleep, morning headaches, and driving sleepiness had the lowest rates. This cluster presented a lower value in the mild severity category and a higher value at the severe level.
Validation cohortProspective data collection resulted in 53 OSA patients, 51% male. The median age was 59 (22–80) years old, with 8 (15%) in the 20–44 years old stratum, 30 (57%) in 45–64, and 15 (28%) in 65–90. Regarding NC and BMI, the median was 40 (31–48) cm and 31 (22–44) Kg/m2, respectively. The highest proportion of patients (n = 35 (66%)) had been diagnosed with mild OSA, followed by moderate (11 (21%)), and severe (7 (13%)) levels. Concerning clinical history, witnessed apneas were reported in 64% of patients, followed by non-repairing sleep (26, 49%) and morning headaches (18, 34%). The most prevalent comorbidity was arrhythmias (4, 8%).
We calculated the dissimilarity between each new patient and the obtained clusters, based on the proposal of Huang,6 as previously mentioned. Afterwards, we created a matrix and assigned the patients to their closest cluster (i.e., the cluster with the lowest dissimilarity), allocating 7 in Cluster 1, 17 in Cluster 2, and 18 in Cluster 3. Eleven patients had the same dissimilarity measure in two (n = 6) or three (5) clusters; we then assigned them randomly to any cluster, by generating 30 random assignments. This resulted in a mean (sd) allocation of 12 (1) in Cluster 1, 20 (1) in Cluster 2, and 21 (2) in Cluster 3. When comparing the proportion of patients in the derivation and validation cohorts in all clusters, we discovered no statistical differences for most variables (gender, age, witnessed apneas, non-repairing sleep, morning headaches, driving sleepiness, congestive heart failure, arrhythmias, pulmonary hypertension) and for the outcome, as showed in supplementary file (B). Regarding BMI and NC, statistical significance was found only in Cluster 1 (P = 0.001 and P = 0.024, respectively), while Mallampati and alcohol consumption was in Cluster 1 (P = 0.043 and P = 0.007) and 3 (P = 0.002 and P<0.001).
DiscussionIn line with other studies, this research contributes to understanding OSA heterogeneity through exploring possible phenotypes by applying categorical cluster analysis (k-modes) in all severity levels. Our findings confirm that patients’ phenotypes can be identified in the OSA population referred to the sleep laboratory (three in our case). Cluster 1 and 3 were middle-aged males or elderly, while Cluster 2 was middle-aged women. We verified that physical examination aspects, such as BMI and NC, were lower in Cluster 1 but extremely high in Cluster 3, especially NC. Regarding clinical history, the overall percentage of modified Mallampati was placed in the lower levels (Mallampati 1 and 2) and driving sleepiness percentages were low (higher value of 13% in Cluster 1). Alcohol consumption pre-sleep was widely described in Cluster 1 and 3. Reported witnessed apneas were higher in Cluster 3 and 1, while nonrepairing sleep and morning headaches in Cluster 2. All the chosen comorbidities (congestive heart failure, arrhythmias, and pulmonary hypertension) were low and without statistical significance in our analysis. The percentage of the outcome measure (AHI) was demonstrated in each cluster; Cluster 2 had 61% [46%−75%] of mild severity, followed by Cluster 1 (56% [47%−66%]) and Cluster 3, with a significantly smaller proportion (45% [32%−59%]), and high percentage in the severe level (29% [18%−43%]. When we observe the probability of belonging to a cluster given the presence of a factor, we can notice that factors such as male gender, lower levels of age and modified Mallampati, witnessed apneas, nonrepairing sleep, morning headaches, driving sleepiness, alcohol consumption, congestive heart failure and arrhythmias put the patient in Cluster 1. On the other hand, elderly obese adults with increased NC, a level 4 modified Mallampati, and pulmonary hypertension, are allocated to Cluster 3. As a result, when applying our approach to the classification of a new case, physicians should choose the cluster with the greatest number of similar variables states, considering the ten statistically significant variables identified: gender, age, BMI, NC, modified Mallampati, witnessed apneas, nonrepairing sleep, morning headaches, driving sleepiness, and alcohol consumption. The validation cohort of OSA patients, confirmed the previous statistically significant variables as gender, age, witnessed apneas, nonrepairing sleep, morning headaches, and driving sleepiness. Additionally, BMI and NC can be considered in Cluster 2 (P = 0.051) and 3 (P≥0.999), while modified Mallampati and alcohol consumption only in Cluster 2 (P = 0.417 and P = 0.085), respectively.
Several authors have hypothesized the possible presence of OSA phenotypes, with the expected benefit of allowing a more precise diagnosis and treatment strategy, leading to improve patients outcomes, as described in the review of Zinchuk et al..4 The referred studies were performed between 2012 and 2019 (a total of 17), with eight studies applying latent class analysis (LCA) as the clustering method, three applying hierarchical clustering (with multiple correspondences analysis for feature selection or principal component analysis (PCA)), one utilizing hierarchical clustering and k-means, two using k-means (with multiple correspondence for feature selection or PCA), one with k-means, one with time-series analysis and dynamic cluster analysis, and one exploiting k-modes (our previous work). Furthermore, the authors referred that these studies differ in terms of individuals included, sample size, patients features and outcomes, presented in the review. We also would like to point out that while our work chose PSG, as the standard diagnosis tool, other studies elected home studies or PSG mixed with home studies (seven studies). In the studies that selected PSG as the gold standard, different AHI cut-offs were applied, namely one study employed AHI ≥518 and two AHI ≥15,19,20 while two other studies do not define the cut-off.21,22 Analysing our results to the one that selected the same AHI cut-off, we noticed some differences. First, the study collected data from PSG, namely position, sleep state and arousals, while ours did not pre-select these variables as we focused our analysis only on pre-diagnostic data. Also, in our work we analysed the data as categorical while this study was numerical, reaching 6 clusters, all related to sleep position or sleep state. The only common aspect is that, like our study, it did not report outcomes. The two studies that reported a cut-off higher than 15 events per hour collected data from PSG in a supine position (not collected in our study) or symptoms and ESS. In this case, LCA was performed, and 4 clusters were found: 1) disturbed sleep; 2) minimally symptomatic; 3) excessively sleep, and 4) moderately sleepy. Although we could compare our results to this study, it is not our aim to assess the association with prevalent and incident cardiovascular disease. The main limitation of cluster analysis is that the phenotypes are always dependent on the number and the quality of the selected variables. Nevertheless, we believe that the process and the results are relevant. The inclusion of a comprehensive number of risk and diagnostic factors, as well as the observed robustness of the cluster-defined phenotypes in the validation cohort, enhances our understanding of OSA heterogeneity, emphasizing that the stereotypical OSA patient needs to be redefined.


