


With continuous global COVID-19 outbreak, differing case numbers and mortality rates are observed. While actual case numbers appear vague, mortality numbers related to COVID-19 seem more precise. In this study, we used the mortality rate as the main indicator to evaluate the extent of underreporting and underdetection of COVID-19 cases.
MethodsWe have analyzed all available data provided by the World Health Organization on the development of international COVID-19 cases and mortality numbers on March 17th, 2020. A crude case-fatality risk (cCFR) and adjusted case-fatality risk (aCFR) was calculated for China, South Korea, Japan, Italy, France, Spain, Germany, Iran and the United States. Additionally, a fold-change (FC) was derived for each country.
ResultsThe highest aCFR and FC were detected for Spain. Based on their FC values, an extremely high number of undetected COVID-19 cases was displayed in France, the United States, Italy and Spain. For these countries, our findings indicate a detection rate of only 1–2% of total actual COVID-19 cases.
ConclusionsDue to limited testing capacities, mortality numbers may serve as a better indicator for COVID-19 case spread in many countries. Our data indicate that countries like France, Italy, the United States, Iran and Spain have extremely high numbers of undetected and underreported cases. Differences in testing availability and capacity, containment as well as overall health care and medical infrastructure result in significantly different mortality rates and COVID-19 case numbers for each respective country.
Amid the current COVID-19 pandemic, a continuous rise in mortality rates has been observed. At the same time, concerns have been voiced that COVID-19 testing has been insufficient and that many countries either lack testing kits and infrastructure, fear associated expenses or that cultural factors may impede virus’ detection.1–4 Once patients are hospitalized, their symptoms are described as flu-like, and their condition often deteriorates and results in death. Prior to a death occurrence, testing is often performed to rule out or confirm a COVID-19 related death. While some countries exhibit such restrictive approaches, others have implemented various measures to contain the virus e.g. social distancing, self-quarantine and lockdown. These measures can also potentially influence the testing procedure. Therefore, to get a better understanding of the spread of the virus in each country, this study compares total reported case numbers for each respective country with total COVID-19 related death numbers. If COVID-19 related mortality remains relatively constant within a certain margin, then this may give a much better estimate of virus spread than the case numbers reported. This study, therefore, aims to assess the extent of COVID-19 undertesting and underreporting based on reported and estimated mortality per case in multiple global epicenters, including China, South Korea, Japan, Italy, France, Spain, Germany, Iran and the United States.5,6
Materials and methodsData sourcesConfirmed COVID-19 casesThe total number of confirmed COVID-19 cases and related deaths for Asia (China, South Korea, Japan), Europe (Italy, France, Spain, Germany), Iran and the United States were sourced from the COVID-19 situation reports made publicly available by the World Health Organization (WHO) on January 20th, 2020. The present study used data reported by the WHO on March 3rd, 2020 and March 17th, 2020 (Fig. 1).7
Outcome measures and statistical analysisCase-fatality risks of COVID-19
The crude case-fatality risk (cCFR) of COVID-19 infections on March 17th, 2020 was calculated by dividing the total number of deaths on March 17th, 2020 by the total number of confirmed cases on March 17th, 2020 for each respective country.8–10 However, it is important to note that deceased patients were typically infected 14 days prior to death occurrence.11 Therefore, we must consider the time lag between infection and death when calculating an adjusted CFR. For this purpose, we compared the total reported death numbers with confirmed COVID-19 cases tested 14 days prior.
Thus, adjusted CFR (aCFR) for each country at date t, accounting for time lags to death, was calculated as follows (Fig. 1)6:
Total number of COVID-19 cases, crude case-fatality risks (cCFR) and adjusted case-fatality risks (aCFR)
Total COVID-19 cases at date t were calculated using the cCFR for each respective country according to the equations below:
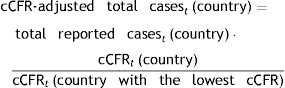
On March 17th, 2020, the cCFR for Germany was the lowest among all investigated countries in the study (0.22%;95% CI: 0.13%–0.37%). This number was used as a benchmark to calculate total COVID-19 cases in other countries. However, the calculated cCFR was not adjusted to the previously described 14-day shift. Adjusted total COVID-19 cases at date t were also calculated. For this purpose, we used the aCFR value for Germany and South Korea. South Korea had the lowest aCFR with 1.68% (95% confidence interval, (CI): 1.36%–2.09%). aCFR values of both countries were used as a benchmark to calculate adjusted total COVID-19 cases in other countries:
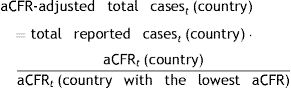
The Wilson score interval method was used to calculate cCFR and aCFR at a 95% CI.5,6 To assess the extent of underreporting and undertesting, we compared adjusted total cases to total reported cases in all countries. This number presents the demonstrated fold change for these countries. Of all countries, the aCFR of South Korea was the lowest on March 17th, 2020 and thus, it was used to calculate the adjusted total COVID-19 cases for the other investigated countries:

All statistical analyses were performed using IBM SPSS Statistics (SPSS Inc., version 25).
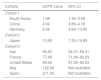
ResultsCOVID-19 case-fatality risksCrude case-fatalityCrude case-fatality risks (cCFR) vary between 0.22% and 8.95%. Countries can be grouped into 3 distinct cohorts according to cCFR values of 1% (cohort 1), 1%–3% (cohort 2) and above 3% (cohort 3). South Korea and Germany are in cohort 1, with rates of 0.97% and 0.22%, respectively.
The second cohort displays a higher cCFR (1%–3%) and includes countries like France (2.25%) and the United States (1.66%). Finally, the third cohort shows the highest cCFR values and ranges from 3.38% to 8.95%. cCFR values are demonstrated in Fig. 2 and summarized in Table 1 with corresponding 95% CI values.
 of major global COVID-19 epicenters (in percent); cCFR varies with numbers >2% (South Korea and US) and <8% (Italy). cCFR values are presented at a 95% CI.")
Crude case-fatality risk (cCFR) values in percent (%).
| Cohorts | cCFR value | 95% CI |
|---|---|---|
| Cohort 1 | ||
| South Korea | 0.97 | 0.78–1.21 |
| Germany | 0.22 | 0.13–0.37 |
| Cohort 2 | ||
| France | 2.25 | 1.92–2.64 |
| United States | 1.66 | 1.28–2.13 |
| Cohort 3 | ||
| China | 3.98 | 3.85–4.12 |
| Japan | 3.38 | 2.35–4.84 |
| Italy | 8.95 | 8.62–9.29 |
| Spain | 3.36 | 3.01–3.75 |
| Iran | 5.69 | 5.33–6.07 |
After adjusting the case-fatality risks (aCFR) for a median time lag of 14 days from first symptom onset to death occurrence, we see an increase in numbers from cCFR to aCFR. This increase is significant for all countries. The mean additive increase from cCFR to aCFR was +68% points. Investigated countries are again divided into three distinct cohorts according to aCFR values: aCFR<10% (cohort 1), 10–50% (cohort 2), >50% (cohort 3). The first cohort includes South Korea, China and Germany with aCFR values of 1.68%, 4.02% and 8.28%, respectively. The second cohort only includes Japan with aCFR at 10.45%. The third cohort is the largest and its values range from 56.83% to 271.05% (see Fig. 3 and Table 2).
 of major global COVID-19 epicenters (in percent); aCFR varies substantially with numbers <10% (Germany and South Korea) and >200%, even exiting the scale (see Spain). aCFR is presented at a 95% CI which is negligible due to the size of the scale.")
Time adjusted case-fatality risks (aCFR) values in percent (%).
| Cohorts | aCFR value | 95% CI |
|---|---|---|
| Cohort 1 | ||
| South Korea | 1.68 | 1.36–2.09 |
| China | 4.02 | 3.89–4.16 |
| Germany | 8.28 | 4.90–13.65 |
| Cohort 2 | ||
| Japan | 10.45 | 7.33–14.69 |
| Cohort 3 | ||
| Iran | 56.83 | 54.31–59.31 |
| France | 77.49 | 71.06–82.83 |
| United States | 90.63 | 81.02–95.63 |
| Italy | 122.94 | Not available |
| Spain | 271.05 | Not available |
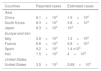
When estimating the real total amount of COVID-19 cases using the cCFR value of Germany as the standard, a considerable increase in COVID-19 case numbers compared to total reported cases is observed. Based on these calculations, we estimated the following numbers for investigated countries. All data is presented as reported vs. estimated cases in Table 3 (Fig. 4).
Estimating total COVID-19 cases and crude case-fatality risks (cCFR).
| Countries | Reported cases | Estimated cases |
|---|---|---|
| Asia | ||
| China | 8.1×10⁴ | 1.5×10⁶ |
| South Korea | 8.3×10³ | 3.8×10⁴ |
| Japan | 8.3×10² | 104 |
| Europe and Iran | ||
| Italy | 2.8×10⁴ | 1.2×10⁶ |
| France | 6.6×10³ | 6.8×10⁴ |
| Spain | 9.2×10³ | 1.4 x10⁵ |
| Iran | 1.5×10⁴ | 4×10⁵ |
| United States | ||
| United States | 3.5×10³ | 2.68×10⁴ |
 and estimated COVID-19 case numbers in global epicenters. Estimations were based on reported COVID-19 deaths and aCFR value for Germany (blue) and South Korea (red). Estimated case numbers for Iran, Italy and Spain exit the scale after adjusting to values from South Korean (aCFR).")
Reported (black) and estimated COVID-19 case numbers in global epicenters. Estimations were based on reported COVID-19 deaths and aCFR value for Germany (blue) and South Korea (red). Estimated case numbers for Iran, Italy and Spain exit the scale after adjusting to values from South Korean (aCFR).
Total COVID-19 cases were again estimated based on aCFR for Germany and South Korea. Doing so, we observed that estimated numbers were lower than when cCFR was used. This is true for all investigated countries (Fig. 5).
Estimation of underreporting and underdetecting demonstrated by fold change
Fold change as an indicator for underreporting and underdetecting displays a wide range of values between 5 until 161. The investigated countries can be grouped into 3 cohorts according to their fold change: 0–<5 (cohort 1), 5–10 (cohort 2) and >10 (cohort 3). The first cohort includes China (2.4) and Germany (4.9). The second cohort includes Japan (6.2). The third cohort includes
Iran (33.8), France (46), the United States (53.8), Italy (73) and Spain (161) (see Fig. 5).
DiscussionWhen analyzing reported death numbers, it becomes apparent that the quality of data on reported case numbers is very heterogenous. Calculated fold change indicates that in some emerging COVID-19 epicenters, (USA CF: 54, Italy: 57 and Spain CF: 161), less than 2 percent of COVID-19 cases were subjected to testing and consequently reported. This data is very concerning and points to extreme undertesting and underreporting. While these numbers may appear extraordinarily high for some epicenters, they may indicate a potentially overwhelmed and exhausted medical system or insufficient medical coverage. This lack of adequate medical services may further increase overall mortality. Impaired medical services can be assumed in countries like Italy, Spain and the United States with constant reports of overwhelmed medical facilities. Quality, quantity and capacity of healthcare systems substantially contribute to the successful management of hospitalized patients and can reduce mortality rates. However, it is very challenging to compare different healthcare systems with respect to COVID-19 mortality rates. While we know that healthcare plays a major role in this pandemic, it is not possible to quantify its effect on current mortality rates.
In fact, there is a wide range of factors that may play a significant role in total case numbers like extent, use and safety measures in public transportation, population density, access and quality of health system (quality and quantity/capacity), local temperature and humidity factors, cultural and religious practices, and how media presents the urgency of this immediate health threat. Our findings show that COVID-19 testing has been insufficient, and that many countries either lack testing resources, e.g. test kits and personnel, or fear associated costs. While CFR values for Germany and South Korea are probably close to actual mortality rates, this is not the case for most global epicenters in the third cohort.12 Containment measures such as isolation, quarantine, lockdown and social distancing are highly effective13,14 in reducing virus’ spread, yet they should be utilized in a meaningful manner. At this point, it remains unclear whether curfew policies, as implemented in Italy, France and Spain, can potentially minimize the damage imposed by inadequate testing and insufficient follow-up of infected cases. Moreover, it further remains unclear how long a general unspecific curfew can be maintained. The repercussions of inadequate testing and follow-up of infected cases remain a key aspect in the fight against global COVID-19 spread. This is especially important because developing countries with immense populations such as India and Pakistan lack adequate testing infrastructure and may heavily depend on the efficacy of curfew measures. The quality of the provided data is one of the limitations of this study, since currently, different data sources on COVID-19 case numbers and deaths are available. Even though COVID-19 case numbers depend on testing efforts, and mortality rates depend on the local definition of a COVID-19 related deaths, there are still discrepancies in national reported cases numbers vs. WHO reported cases vs. case numbers provided by the Johns Hopkins University. Additionally, we increasingly observe retrospective corrections of COVID-19 related deaths in countries. Interestingly, we now receive reports of sudden increases in mortality numbers which are supposedly not COVID-19 related, yet no further explanation for this increase is provided. For most of these deaths, unspecific pneumonia is listed as the primary cause of death.
ConclusionOur data support concerns about massively insufficient testing in many global COVID-19 epicenters compared to Germany and South Korea. If we assume that mortality rates are roughly stable, COVID-19 related mortality numbers might serve as a better indicator than case numbers to grasp the extent of COVID-19 spread. However, it is important to note that COVID-19 related mortalities typically occur 14 days after infection.
Ethics statementNo ethical approval was required for this study.
Author contributionHL: data acquisition, data interpretation, final analysis, drafting of the manuscript, final approval for publication. Hlau2@uci.edu.
TK: data acquisition, analysis and interpretation, drafting of the manuscript, final approval for publication. tkhosrawipour@gmail.com.
PK: data interpretation, drafting of the manuscript, final approval for publication. Piotr.kocbach@uwm.edu.pl.
HI: data interpretation, drafting of the manuscript, statistical analyses. hichii@uci.edu.
JB: data interpretation, critical revision for important intellectual content, final approval for publication. Jacek.bania@upwr.edu.pl.
VK: data interpretation, conception and design of the work, critical revision for important intellectual content, final approval for publication. veriakhosrawipour@yahoo.de.
FundingThe authors did not receive any funding for this study.
Conflicts of interestThe authors have declared no conflicts of interest.
Availability of data and materialsThe datasets used and/or analyzed during the current study are available from the corresponding author upon reasonable request.


