
It was already evidenced decreased heart rate variability (HRV) in chronic obstructive pulmonary disease (COPD) patients at rest.
ObjectiveIn order to insert new elements in the literature regarding this issue, we evaluated geometric index of HRV in COPD subjects.
MethodWe analyzed data from 34 volunteers, divided into two groups according to spirometric values: COPD (17 volunteers, FEV1/FVC=47.3±10.2; FEV1=50.8±15.7) and control (17 volunteers, FEV1/FVC=78.8±10.8; FEV1=100.1±14.7). For analysis of HRV indexes the volunteers remained in the supine position for 30minutes. We analyzed the following indexes: triangular index (RRtri), triangular interpolation of RR intervals (TINN) and Poincaré plot (SD1, SD2 and SD1/SD2). Student's t-test for unpaired samples and Mann–Whitney test were used for data analysis.
ResultsWe observed statistically significant reductions in geometric indexes in the COPD group: RRtri (0.043±0.01 vs. 0.059±0.02; p=0.018), TINN (105.88±51.82 vs. 151.47±49.9; p=0.014), SD1 (9.76±4.66 vs. 14.55±6.04; p=0.014) and SD2 (34.86±17.02 vs. 51.51±18.38; p=0.010). SD1/SD2 (0.30±0.11 vs. 0.28±0.07; p=0.605) were not significantly different between groups. Patients with COPD presented a visual analysis of Poincaré plot of lower dispersion of RR intervals both beat-to-beat and the long-term.
ConclusionSubjects with COPD present reduction of geometric indexes of HRV, indicating reduced heart rate variability.
A redução da variabilidade da frequência cardíaca (VFC) em pacientes com doença pulmonar obstrutiva crónica (DPOC) em repouso já foi evidenciada na literatura.
ObjetivoCom intuito de inserir elementos na literatura sobre essa temática, foram avaliados índices geométricos de VFC de indivíduos com DPOC.
MétodoForam analisados dados de 34 voluntários, divididos em dois grupos, de acordo com os valores espirométricos, com 17 voluntários cada: DPOC (VEF1/CVF=47,3±10,2; VEF1=50,8±15,7) e controle (VEF1/CVF=78,8±10,8; VEF1=100,1±14,7). Para análise dos índices de VFC, a frequência cardíaca foi captada batimento a batimento com os voluntários em decúbito dorsal por 30 minutos. Foram analisados os índices seguintes: índice triangular (RRtri), interpolação triangular dos intervalos RR (TINN) e plot de Poincaré (SD1, SD2 e relação SD1/SD2). Foi realizada também análise visual da figura formada no plot de Poincaré. Teste t de Student para dados não pareados e teste de Mann–Whitney com nível de significância de 5% foram utilizados para análise dos dados.
ResultadosForam observadas reduções estatisticamente significativas dos índices geométricos: RRtri (0,043 vs. 0,059, p=0,018), TINN (105,88 vs. 151,47, p=0,014), SD1 (9,76 vs. 14,55, p=0,014) e SD2 (34,86 vs. 51,51, p=0,010) no grupo DPOC. A relação SD1/SD2 (0,30±0,11 vs. 0,28±0,07; p=0,605) não apresentou diferença significativa entre os grupos. Os voluntários com DPOC apresentaram na análise visual do plot de Poincaré menor dispersão dos intervalos RR, tanto batimento a batimento como em longo prazo.
ConclusãoIndivíduos com DPOC apresentaram diminuição dos índices geométricos da VFC, indicando que apresentam redução da variabilidade da frequência cardíaca.
Chronic obstructive pulmonary disease (COPD) is considered a preventable and treatable condition which is characterized by not fully reversible airflow chronic obstruction1,2 and systemic manifestations, such as nutritional depletion, functional and structural alterations of peripheral and respiratory muscles and arrhythmias.3 Changes in autonomic nervous system (ANS) are also observed in COPD subjects4,5; this counts as a negative factor, since ANS modulates internal functions of the body; hence, it deserves further attention.
A well recognized method of evaluating the autonomic behavior is the heart rate variability (HRV), the conventionally accepted term to describe the fluctuations in the intervals between consecutive heart beats (RR intervals), which are related to influences of the ANS on the sinusal node.6 Among all methods used to describe geometric methods we may include HRV triangular index (RRtri), triangular interpolation of NN interval (TINN) and Poincaré plot. This method allows us to present RR intervals in geometric pattern and the use of an approach to derive HRV measurement.7
The RRtri and TINN are calculated based on the construction of a histogram density of normal RR intervals which contains the RR intervals length in the x-axis and the frequency at which they occurred in the y-axis. The junction of the histogram columns forms a shape similar to a triangle which is extracted from these indexes.6,8 The Poincaré plot is a graphic representation of two-dimensional correlation between consecutive RR intervals, where each interval is plotted against the next interval.7,9,10 They may be analyzed in a qualitative way, by assessing the shape formed by its attractor, which shows the degree of RR intervals complexity,11,12 or quantitatively, by fitting the ellipse of the figure formed by the attractor from where the indexes are obtained: SD1, SD2 and SD1/SD2 ratio.13,14 The analysis of the Poincaré plot is considered by some authors to be based on nonlinear dynamics.7,15
Reduced HRV in COPD patients at rest has already been observed, compared to control subjects at the same age.16–18 Reductions were reported in variables which correspond to sympathetic and parasympathetic modulations together5 and parasympathetic isolated.18 Those investigations regarding specific alterations in autonomic function in COPD determined the use of linear methods in the time and frequency domain. However, to the best of our knowledge, there are few research studies evaluating HRV in COPD patients by means of geometric indexes. After searching the relevant technical literature, only one study was found, and this work used TINN.19 In this study, they showed lower values of this index in COPD individuals compared to healthy subjects.
In order to bring new elements into the literature about this subject we endeavored to evaluate geometric index of HRV in COPD subjects.
Material and methodsStudy populationIn order to conduct the study we recruited all patients available at the Centro de Estudos e Atendimento em Fisioterapia e Reabilitação da Faculdade de Ciências e Tecnologia – FCT/UNESP (Center for Research and Care in Physical Therapy and Rehabilitation, Faculty of Science and Technology – FCT/UNESP) (Presidente Prudente, Brazil) to make up the COPD group. All patients presented medical diagnosis of COPD and met the following inclusion criteria: (1) medical diagnosis of COPD confirmed by spirometry according to Global Initiative for Chronic Obstructive Pulmonary Disease (GOLD),1 (2) not being current smokers, since nicotine alters the cardiac autonomic modulation,20 (3) not taking medication that influences the cardiac autonomic modulation, (4) absence of metabolic diseases, and (5) absence of COPD exacerbation in the two months prior to the experimental protocol. If the patients who were otherwise unhealthy they were not included in the sample.
We selected 17 patients (10 male) with medical diagnosis of COPD and classified them according to GOLD II–III, through spirometric test based on spirometric values.1 The control group consisted of 17 apparently healthy subjects (8 male) who presented normal spirometric values.
All volunteers were informed about the procedures and objectives of the study and upon agreement they signed a consent letter. All work procedures were approved by the Ethics Committee in Research of our University (Protocol number 246/08) and followed the resolution 196/96 of the National Health Council 10/10/1996.
Initial evaluationBefore the experimental procedure, volunteers were identified by collecting the following information: age, gender, weight, height and body mass index (BMI). Anthropometric measurements were obtained according to Lohman et al.21 Weight was determined by using a digital scale (W 200/5, Welmy, Brazil) with a precision of 0.1kg. Height was determined by using a stadiometer (ES 2020, Sanny, Brazil) with a precision of 0.1cm and 2.20m of extension. Body mass index (BMI) was calculated using the following formula: weight (kg)/height (m)2.
Experimental protocolThe data collection was carried out in a room with the temperature between 21°C and 24°C and relative humidity between 40 and 60% and volunteers were instructed not to drink alcohol and caffeine for 24h before evaluation. Data were collected on an individual basis, between 8 and 11AM to minimize the interference of the circadian rhythm. All procedures necessary for the data collection were explained on an individual basis and the subjects were instructed to remain at rest and avoid talking during the collection.
After the initial evaluation the heart monitor belt was then placed over the thorax, aligned with the distal third of the sternum and the Polar S810i heart rate receiver (Polar Electro, Finland) was placed on the wrist. The equipment was previously validated for monitoring beat-by-beat heart rate as well as the use of these data for HRV analysis.22–24 Subjects were placed in the dorsal decubitus position on a cushion and remained at rest with spontaneous breathing for 30min.
After the experimental procedures we performed spirometry tests in order to identify and stratify the degree of bronchial obstruction (average of 3 tests). We used the Spirobank spirometer and a computer equipped with WinspiroPRO 1.1.6 software (Medical International Research, Rome, Italy). Data analysis was done according to the criteria described by the Guidelines for Lung Function Tests.25
HRV index evaluationThe HRV behavior pattern was recorded beat-by-beat throughout the monitoring process at a sampling rate of 1000Hz. During the period of higher signal stability an interval of 5min was selected and only series with more than 256 RR intervals were used for analysis,6 following digital filtering complemented with manual filtering for the elimination of premature ectopic beats and artifacts. Only series with more than 95% sinus rhythm were included in the study.25–28
The following geometric indexes were evaluated: RRtri, TINN and Poincaré plot (SD1, SD2 and SD1/SD2 ratio).
The RRtri was calculated from the construction of the histogram density of normal RR intervals and was obtained by integral division of the histogram (i.e. total number of RR intervals) by the maximum density distribution (modal frequency of the RR intervals), measured on a discrete scale with boxes of 7.8125ms (1/128s).6
The TINN is the distribution baseline width measured as a triangular base, approximating the distribution of all RR intervals. The difference of least squares was used to determine the triangle.6
For construction of the Poincaré plot each RR interval was represented as a function of the previous interval and quantitative analysis of Poincaré plot indexes was performed as follows: SD1 (standard deviation of instantaneous beat-by-beat variability), SD2 (standard deviation in long term of the RR interval) and the SD1/SD2 ratio.13 The qualitative analysis (visual) of the Poincaré plot was performed by analysis of the figures formed by the attractor of the plot, which are described below:29,30
- (1)
Figure which presents increased RR intervals dispersion, increased RR intervals, characteristic of a normal plot.
- (2)
Figure with small beat-by-beat global dispersion and without RR intervals dispersion in long term.
We used the HRV analysis software – Version 2.0 in order to assess those indexes.31
Statistical analysisFor the comparison of the groups, the Shapiro–Wilk test was first used to determine the normality of the data. When normal distribution was determined, the non-paired Student's t-test was employed to non-paired variables (age, SD1, SD2, SD1/SD2, RRtri and TINN). When normal distribution was not determined, the Mann–Whitney test was employed (weight, height, BMI, forced expiratory volume at the first second – FEV1, forced expiratory volume at the first second/forced vital capacity – FEV1/FVC and peak expiratory flow – PEF). Differences were considered significant when the probability of a Type I error was lower than 5% (p<0.05).
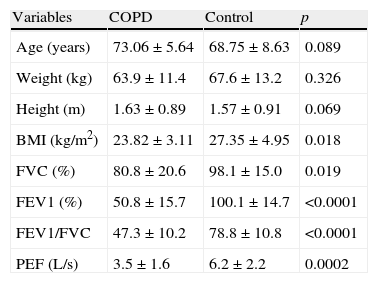
ResultsTable 1 presents anthropometric measurements and spirometric values in COPD and control groups. We observed that BMI, forced vital capacity (FVC), forced expiratory volume at the first second (FEV1), ratio of forced expiratory volume, forced vital capacity (FEV1/FVC) and peak expiratory flow (PEF) were significantly lower in COPD subjects compared to the control group.
Anthropometric and spirometric profile of COPD and control groups.
| Variables | COPD | Control | p |
| Age (years) | 73.06±5.64 | 68.75±8.63 | 0.089 |
| Weight (kg) | 63.9±11.4 | 67.6±13.2 | 0.326 |
| Height (m) | 1.63±0.89 | 1.57±0.91 | 0.069 |
| BMI (kg/m2) | 23.82±3.11 | 27.35±4.95 | 0.018 |
| FVC (%) | 80.8±20.6 | 98.1±15.0 | 0.019 |
| FEV1 (%) | 50.8±15.7 | 100.1±14.7 | <0.0001 |
| FEV1/FVC | 47.3±10.2 | 78.8±10.8 | <0.0001 |
| PEF (L/s) | 3.5±1.6 | 6.2±2.2 | 0.0002 |
COPD: chronic obstructive pulmonary disease; BMI: body mass index; FVC: forced vital capacity; FEV1: forced expiratory volume at the first second; PEF: peak expiratory flow.
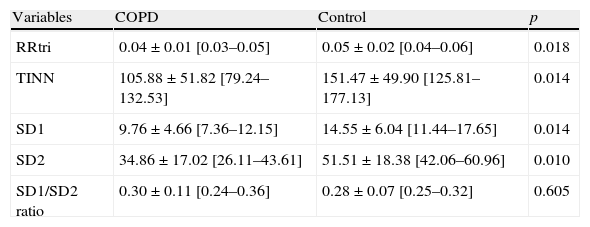
Table 2 displays RRtri, TINN, SD1, SD2 and SD1/SD2 ratio in control and COPD groups. We noted reduced values of RRtri, TINN, SD1 and SD2 in COPD subjects. However, there was no significant difference between control and COPD groups regarding SD1/SD2 ratio.
Mean values, standard deviation of mean, 95% confidence interval and p values of RRtri, TINN and Poincaré plot of control and COPD groups.
| Variables | COPD | Control | p |
| RRtri | 0.04±0.01 [0.03–0.05] | 0.05±0.02 [0.04–0.06] | 0.018 |
| TINN | 105.88±51.82 [79.24–132.53] | 151.47±49.90 [125.81–177.13] | 0.014 |
| SD1 | 9.76±4.66 [7.36–12.15] | 14.55±6.04 [11.44–17.65] | 0.014 |
| SD2 | 34.86±17.02 [26.11–43.61] | 51.51±18.38 [42.06–60.96] | 0.010 |
| SD1/SD2 ratio | 0.30±0.11 [0.24–0.36] | 0.28±0.07 [0.25–0.32] | 0.605 |
RRtri: triangular index; TINN: triangular interpolation of RR interval; SD1: standard deviation of instantaneous beat-to-beat variability; SD2: standard deviation in long term of the RR interval.
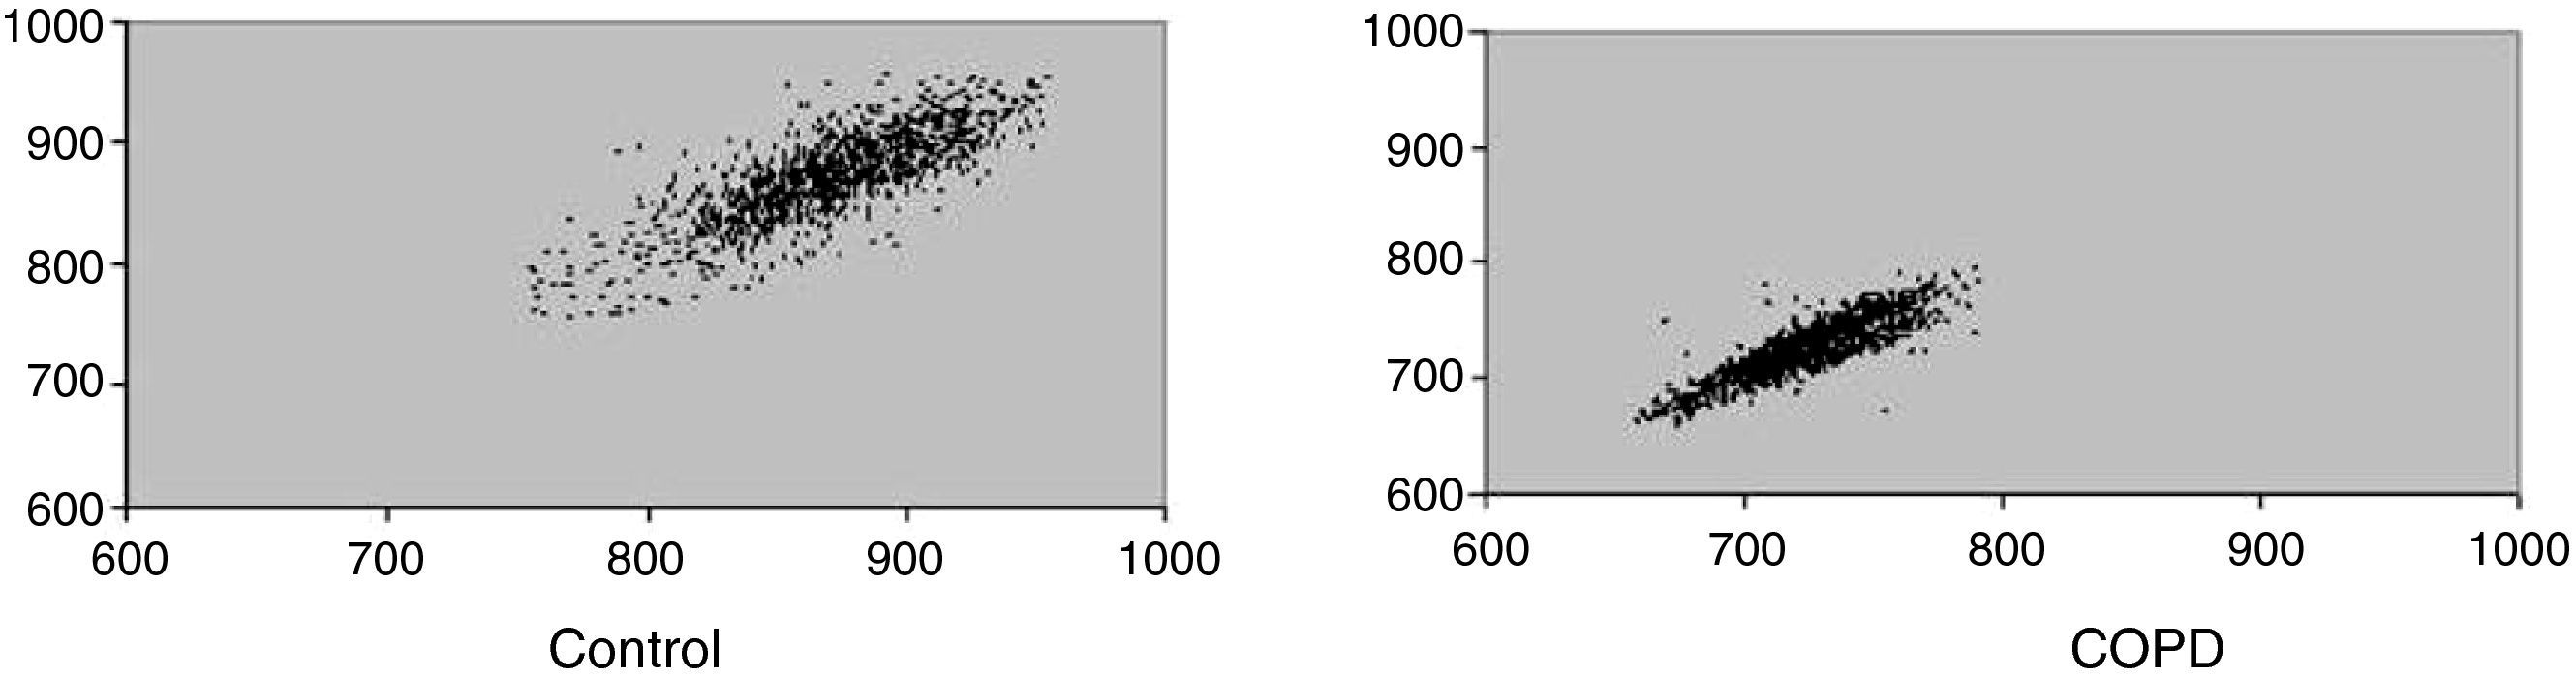
Fig. 1 shows a representative example of Poincaré plot standard in one control and one COPD subject. It suggests reduced parasympathetic activity in COPD individuals.
Discussion and COPD (SD1=8.0 and SD2=30.3) individuals.")
In this study we evaluated geometric index of HRV in COPD subjects. Our results show that the SD1 index is reduced in the COPD group as well as SD2, TINN and RRtri. On the other hand, the SD1/SD2 ratio was similar between control and COPD groups. These findings suggest reduced HRV in COPD subjects.
SD1 index was decreased in COPD individuals compared to control subjects; we suggest reduced parasympathetic activity in COPD patients. This index represents the transverse axis of the Poincaré plot; it corresponds to the standard deviation of the instantaneous variability of heart rate beat-by-beat13,32 and indicates the parasympathetic influence on the sinoatrial node.30,33 Reduction of vagal modulation in COPD patients, as assessed by time and frequency domain was also found by Pantoni et al.5 who observed reduction of RMSSD [square root of the mean squared differences of successive NN intervals] and high frequency (HF) in COPD individuals.
Indexes of the overall autonomic modulation (SD2, TINN and RRtri) were also reduced in COPD subjects. Our data are supported by the literature, which points to a general autonomic damage in COPD.19,34,35 Paschoal et al.16 and Volterrani et al.18 found reduction of global autonomic modulation in COPD patients compared to control group by means of SDNN [standard deviation of normal to normal] index obtained in the time domain, which supports results in the same condition at rest, but using the low frequency (LF) index.17,36
TINN was significantly decreased in COPD compared to control group. These findings are in agreement with Sin et al.,19 who found that the TINN of COPD patients was lower in healthy volunteers (322ms vs. 444ms). It is noteworthy that even the average TINN obtained in this investigation is lower than those found by these authors,19 which may be related to the older age of the study population compared to the average age of the Sin et al. study.22
Concerning the SD1/SD2 ratio analysis, we reported no significant differences between COPD and control groups. This may be explained by the observed reduction of both indexes (SD1 and SD2) in COPD subjects.
Visual analysis (qualitative) of the Poincaré plot allowed us to observe reduction of HRV in COPD patients. In these individuals there was lower dispersion of RR intervals both beat-by-beat and long-term, which characterizes reduction of HRV. In control subjects the intervals between heart beats are irregular, which lead us to visualize a cloud of points in the Poincaré plot. The mechanism by which the autonomic modulation is altered in COPD is not well established. Hypotheses are considered in relation to the prevailing tone in these cases, because the hyperinflation (feature of vagal activity) could generate a pulse change.17 Additionally, hypoxic patients may suffer from abnormal autonomic function34 and oxygen supplementation could partially reverse this dysfunction.4
It is clear in the literature that reduced HRV is indicative of poor prognosis in cardiovascular disease,27 it is also related to arrhythmias37 and sudden death.38 Furthermore, it is well recognized that cardiovascular diseases often coexist with COPD and are a source of morbidity and mortality in COPD patients.2,4,5 Likewise, the beneficial effects of exercise on cardiac autonomic modulation have been reported.13,14,16 Thus, we highlight the importance of pulmonary rehabilitation in COPD treatment, especially for the supervised practice of physical activity.
Our study presents a limitation that should be addressed: the anthropometric characteristics of volunteers should be discussed. It was not possible to maintain the same BMI between the COPD and control groups. COPD is a systemic disease, the increase in inflammatory mediators may contribute to an increased metabolism and imbalance between food intake and energy expenditure, leading to the weight loss observed in these individuals,1,3 reflected by lower BMI in the COPD group. It is well recognized that obesity causes changes in cardiac autonomic modulation.30,39 On the other hand, the effects of the reduction of BMI on HRV in patients with COPD are not known. Further studies evaluating autonomic modulation in COPD and controls are needed.
Another limitation of this study was the absence of specific clinical tests to evaluate the cardiac condition of the volunteers. However, all these volunteers were evaluated by doctors to establish the diagnosis and we understand that if there were any cardiac disease, the volunteer would report this condition. As mentioned above, when some health problem was reported the subject was not included in the sample.
In summary, the analysis by means of geometric indexes suggests that COPD individuals present autonomic dysfunction, characterized by reductions of heart rate variability. Our findings are relevant, since the results indicate that these indexes, obtained by a non-invasive and inexpensive method, may be useful both for clinical manifestations of systemic disease and for risk stratification and monitoring of therapeutic procedures performed with these patients.
In conclusion, geometric indexes of HRV in COPD individuals were reduced compared to control subjects. Therefore, we indicate that COPD patients present reduced HRV.
Conflicts of interestThe authors confirm that there are not conflict of interest to declare.
This research received the financial support from FUNDUNESP (Process number 00704/08 – DFP).
Please cite this article as: Dias de Carvalho, T. Índices geométricos de variabilidade da frequência cardíaca na doença pulmonar obstrutiva crônica. S0873-2159(11)00072-9.


