
Minimally important differences (MIDs) for common outcomes of pulmonary rehabilitation are well documented for people with chronic obstructive pulmonary disease (COPD). It is not known whether MIDs differ based on COPD disease characteristics. This study aimed to estimate MIDs for clinical outcomes of pulmonary rehabilitation dependent upon baseline characteristics.
MethodsA database containing 2791 people with COPD was split into derivation (n=2245; age 66±9 years; 50% males; FEV1 47±20% predicted) and comparator (n=546; age 66±9 years; 47% males; FEV1 46±21% predicted) cohorts. MIDs were estimated using 0.5 x SD (symmetrically distributed) or 0.5 x IQR (non-symmetrically distributed) for: 6-minute walk test (6MWT), constant work rate test (CWRT), COPD assessment test (CAT), St. George's respiratory questionnaire (SGRQ), hospital anxiety and depression scale (HADS), and fat-free mass index (FFMI). MIDs were estimated based on baseline outcome scores, lung function, modified medical research council (mMRC) grade and FFMI.
ResultsMID estimates were comparable to previously reported values. MIDs for SGRQ domains (Symptom=8.7 points, Activity=7.1 points, Impact=8.1 points) and FFMI were produced (0.36kg/m2). There was greater variation of change in 6MWT, SGRQ-activity, SGRQ-impact, HADS and FFMI on which the MIDs were determined when categorising for baseline values (all, p<0.05). Greater variation of change in 6MWT on which the MIDs were determined was evident with COPD disease severity grouping (p<0.05). The magnitude of change in 6MWT, CAT, CWRT, SGRQ-activity, and FFMI with baseline mMRC score categorisation resulted in greater variation on which the MIDs were determined (all, p<0.05). Baseline stratification for FFMI resulted in greater variation of change in CWRT (p<0.001) and HADS-depression (p = 0.043) on which MIDs were determined.
DiscussionFindings suggest that baseline presentation should be considered for people with COPD when assessing the efficacy of pulmonary rehabilitation. However, clinical significance of the variation underpinning MIDs is yet to be determined.
Pulmonary rehabilitation is considered a cornerstone treatment in the management of Chronic Obstructive Pulmonary Disease (COPD) for inducing improvements in exercise capacity and health-related quality of life.1 People with COPD undergoing pulmonary rehabilitation present with a diverse range of health care needs as defined by variability in disease severity, functional exercise capacity and psychological well-being.2 The effectiveness of pulmonary rehabilitation programmes is commonly determined by changes in exercise capacity (e.g., 6-minute walk test (6MWT), constant work rate test (CWRT)), health-related quality of life measures (e.g., COPD Assessment Tool (CAT), St. Georges Respiratory Questionnaire (SGRQ)), mental health (e.g., Hospital Anxiety & Depression Scale (HADS)), and body composition (fat free mass index (FFMI)).3 However, statistical analysis of changes in clinical outcome measures can often be misleading and may not be clinically relevant to patients and/or healthcare professionals.4
The minimally important difference (MID) was defined to address misleading statistics by calculating the smallest difference in a measured clinical parameter that is assumed to reflect a clinically meaningful impact in a patient's condition, for better or worse, as perceived by the patient, clinician, or investigator.5 MIDs can be determined using different approaches; anchor-based, distribution-based, and Delphi methods.4 The MIDs developed in respiratory research thus far have been highlighted with differing thresholds and/or ranges defined using either anchor-based or distribution-based methods.6 Distribution-based methods have been suggested to have an advantage of being simpler to use as they do not require an external criterion as observed with the anchor-based method.7
There is established evidence, especially in the field of medical statistics, stating that baseline differences could be key to the variety in the magnitude of effect seen with intervention.8 This has recently been demonstrated to be the case with pulmonary rehabilitation,9-11 whereby people with COPD presenting with poorer exercise capacity and higher symptom burden pre-rehabilitation stand to achieve greater benefits with pulmonary rehabilitation. Several MIDs used in practice are based on distribution-based approaches covering the COPD population as a whole, whereby the variation in response to pulmonary rehabilitation is used to determine MIDs. It is important to reassess the current state of MIDs to evaluate programme efficacy accounting for baseline differences. Currently available MIDs are disease specific and not patient specific. These MIDs may lack specificity leading to the potential over- or under-estimation of effects seen with pulmonary rehabilitation depending on patient presentation. Therefore, it is important to begin to build on the development of MIDs in the context of pulmonary rehabilitation to offer more personalised and contextualised MIDs for common clinical outcomes.
This study aimed to develop new MIDs for clinical outcomes (6MWT, CWRT, HADS, CAT & SGRQ, FFMI) of pulmonary rehabilitation in people with COPD based on stratification for baseline values and disease characteristics (disease severity according to GOLD grade, modified Medical Research Council dyspnea scale (mMRC) grade, body composition according to FFMI) using the distribution-based approach.
MethodsThis study was conducted using the Ciro clinical pulmonary rehabilitation database for which patients had not objected to the storing of data for research purposes. Ethical approval for this study was waived by the medical ethics committee of the University Hospital Maastricht and Maastricht University (METC azM/UM) because the Medical Research Involving Human Subjects Act (WMO) does not apply to this study (METC 2020-1542).
PopulationData were extracted from the electronic patient files consisting of 2791 people with a clinical diagnosis of COPD (International Classification of Diseases and Related Health Problems (ICD-10) J43 or J44, mMRC >0, post-bronchodilator FEV1/FVC <0.70 according to GOLD guidelines12). Patients were evaluated at initial assessment of a comprehensive pulmonary rehabilitation programme at Ciro, a tertiary care centre for people with complex chronic respiratory diseases in Horn (The Netherlands) which they completed between July 2013 and August 2020.
InterventionThe pulmonary rehabilitation programme delivered by Ciro for people with COPD is comprehensive and multidisciplinary in nature. Performed in line with the American Thoracic Society & European Respiratory Society guidance,13 the programme consists of supervised exercise training, education, psychosocial counselling, nutritional counselling, COPD exacerbation management, and occupational therapy.10 Ciro offers pulmonary rehabilitation in both the inpatient (8 weeks, 5 sessions per week; 40 sessions in total) and outpatient (8 weeks, 3 sessions per week, followed by 8 weeks, 2 sessions per week; total of 40 sessions) setting.10 Exercise training was performed at a moderate-high intensity to achieve an overload stimulus. Intensity was increased during rehabilitation based on dyspnoea and fatigue symptom scores. The exercise programme comprised of flexibility exercises, general physical exercise for lower and upper extremities, and daily supervised 30-min outdoor walks. The most dyspneic and frail inpatients were offered neuromuscular electrical stimulation of lower-limb muscles instead of the exercise training, as described before.14 A detailed psychosocial and physical assessment of each patient was undertaken during the initial and final assessments for pulmonary rehabilitation.
MeasurementsDemographics, body mass index (BMI), body composition (FFMI: determined by dual-energy x-ray absorptiometry), and degree of breathlessness (mMRC grade) were assessed pre- and post-pulmonary rehabilitation. Post-bronchodilator spirometry was performed to confirm COPD diagnosis (FEV1/FVC <0.70) and divide patients into GOLD stages of disease severity; mild, moderate, severe, and very severe.12 Health status was assessed using the CAT15 (score range: 0-40 points) and Dutch version of the COPD-specific SGRQ16 (score range: 0-100 points). Symptoms of anxiety and depression were assessed using the HADS scale17 (score range: 0-21 points). Functional exercise capacity was assessed using the 6MWT, performed in accordance with ERS/ATS standards,18 and the CWRT, set at 75% of the determined peak work rate derived from a maximal incremental cycle test.19
MID calculationDistribution-based MIDs were calculated for each clinical outcome using 0.5 x standard deviation (SD) of change from pre- to post-rehabilitation for symmetrically distributed outcomes. Where outcomes were non-symmetrically distributed, 0.5 x interquartile range (IQR) was used. To calculate personalised MIDs for CWRT, SGRQ-S, SGRQ-A, and SGRQ-I, data were split into tertiles for each outcome using baseline outcome scores (T1 = low, T2 = moderate, T3 = high). For 6MWT (<350m vs ≥350m),20 CAT (<18 vs ≥18 points),21 SGRQ-T (<46 vs ≥46 points),22 HADS-A (<8 vs ≥8 points),22 HADS-D (<8 vs ≥8 points),22 and FFMI (‘abnormal’ <15kg/m2 for females and <17kg/m2 for males vs ‘normal’ ≥15kg/m2 for females and ≥17kg/m2 for males)23 patients were split into ‘abnormal’ or ‘normal’ baseline outcome values using clinically relevant cut-offs. Further subset MIDs for these outcomes were calculated based on disease characteristics at baseline (mild, moderate, severe, very severe COPD; mMRC 1, 2, 3, 4; ‘abnormal’ FFMI vs ‘normal’ FFMI (in line with the criteria above)).
Statistical analysisStatistical analyses were performed using SPSS (v25.00; SPSS Inc., Chicago, IL, USA). Data was randomly partitioned with an 80/20 ratio, as is commonly used and recommended in large datasets,24 into two groups to provide a derivation (n = 2245) and comparator (n = 546) cohort for the calculating of MIDs. All statistical analyses were undertaken primarily using the derivation cohort, with estimated MIDs compared with the comparator cohort. Baseline demographics and outcomes of the derivation cohort are presented as mean and SD for symmetrically distributed outcomes, and as median and IQR for non-symmetrically distributed outcomes. All data were tested for symmetry by assessing skewness scores with values lower than -0.5 or above 0.5 considered as non-symmetrically distributed. If one MID was not normally distributed, all MIDs for the outcome were assessed using 0.5 x IQR. To assess differences in the MIDs between groups in both cohorts (low (T1) vs moderate (T2) vs high (T3); abnormal vs normal; mild vs moderate vs severe vs very severe; mMRC 1 vs 2 vs 3 vs 4; abnormal FFMI vs normal FFMI), the homogeneity of variances was tested with Levene's test to assess whether the variances were equal between groups. Statistical significance was accepted at p < 0.05. If the assumption of Levene's was violated when including >2 groups, post-hoc Levene's independent t-test was used to further explore differences between subgroups. An adjustment for multiple testing was made with a Bonferroni correction. Statistical significance following correction was accepted at p < 0.0167.
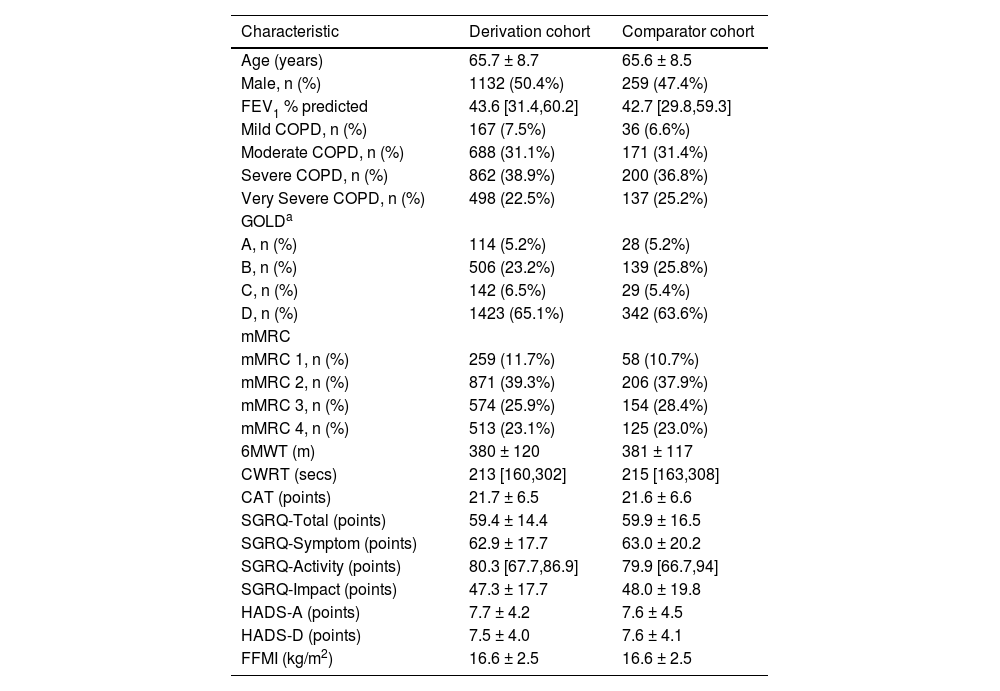
ResultsThe demographics of the derivation and comparator cohorts who completed a pre-rehabilitation assessment are presented in Table 1.
Baseline population characteristics.
| Characteristic | Derivation cohort | Comparator cohort |
|---|---|---|
| Age (years) | 65.7 ± 8.7 | 65.6 ± 8.5 |
| Male, n (%) | 1132 (50.4%) | 259 (47.4%) |
| FEV1 % predicted | 43.6 [31.4,60.2] | 42.7 [29.8,59.3] |
| Mild COPD, n (%) | 167 (7.5%) | 36 (6.6%) |
| Moderate COPD, n (%) | 688 (31.1%) | 171 (31.4%) |
| Severe COPD, n (%) | 862 (38.9%) | 200 (36.8%) |
| Very Severe COPD, n (%) | 498 (22.5%) | 137 (25.2%) |
| GOLDa | ||
| A, n (%) | 114 (5.2%) | 28 (5.2%) |
| B, n (%) | 506 (23.2%) | 139 (25.8%) |
| C, n (%) | 142 (6.5%) | 29 (5.4%) |
| D, n (%) | 1423 (65.1%) | 342 (63.6%) |
| mMRC | ||
| mMRC 1, n (%) | 259 (11.7%) | 58 (10.7%) |
| mMRC 2, n (%) | 871 (39.3%) | 206 (37.9%) |
| mMRC 3, n (%) | 574 (25.9%) | 154 (28.4%) |
| mMRC 4, n (%) | 513 (23.1%) | 125 (23.0%) |
| 6MWT (m) | 380 ± 120 | 381 ± 117 |
| CWRT (secs) | 213 [160,302] | 215 [163,308] |
| CAT (points) | 21.7 ± 6.5 | 21.6 ± 6.6 |
| SGRQ-Total (points) | 59.4 ± 14.4 | 59.9 ± 16.5 |
| SGRQ-Symptom (points) | 62.9 ± 17.7 | 63.0 ± 20.2 |
| SGRQ-Activity (points) | 80.3 [67.7,86.9] | 79.9 [66.7,94] |
| SGRQ-Impact (points) | 47.3 ± 17.7 | 48.0 ± 19.8 |
| HADS-A (points) | 7.7 ± 4.2 | 7.6 ± 4.5 |
| HADS-D (points) | 7.5 ± 4.0 | 7.6 ± 4.1 |
| FFMI (kg/m2) | 16.6 ± 2.5 | 16.6 ± 2.5 |
Data presented as mean ± SD, % of population or median [IQR].
GOLD grade based on mMRC grade. 6MWT, six-minute walk test; CAT, COPD assessment tool; COPD, chronic obstructive pulmonary disease; CWRT, constant work rate test; FEV1, forced expiratory volume in one second; FFMI, fat-free mass index; GOLD, global initiative for chronic obstructive lung disease; HADS, hospital anxiety and depression scale; mMRC, modified medical research council dyspnoea scale; SGRQ- St. George's Respiratory Questionnaire.
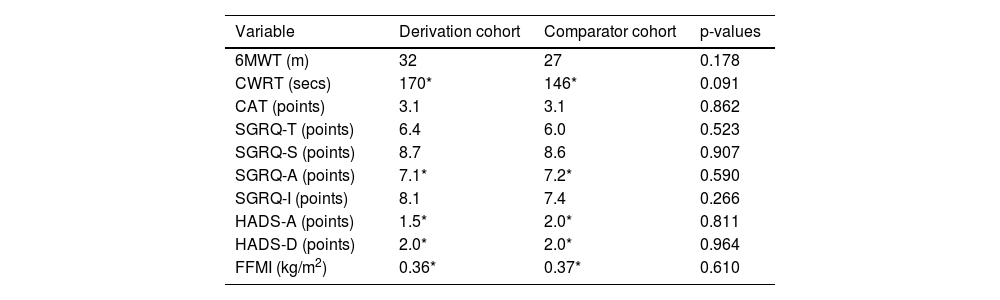
There were no significant differences between the derivation and comparator cohorts in terms of MIDs for each outcome (all, p > 0.05) (Table 2).
MIDs for outcomes following pulmonary rehabilitation.
| Variable | Derivation cohort | Comparator cohort | p-values |
|---|---|---|---|
| 6MWT (m) | 32 | 27 | 0.178 |
| CWRT (secs) | 170* | 146* | 0.091 |
| CAT (points) | 3.1 | 3.1 | 0.862 |
| SGRQ-T (points) | 6.4 | 6.0 | 0.523 |
| SGRQ-S (points) | 8.7 | 8.6 | 0.907 |
| SGRQ-A (points) | 7.1* | 7.2* | 0.590 |
| SGRQ-I (points) | 8.1 | 7.4 | 0.266 |
| HADS-A (points) | 1.5* | 2.0* | 0.811 |
| HADS-D (points) | 2.0* | 2.0* | 0.964 |
| FFMI (kg/m2) | 0.36* | 0.37* | 0.610 |
Due to non-symmetrical distribution, MIDs presented as 0.5 x IQR. 6MWT, six-minute walk test; CAT, COPD assessment tool; CWRT, constant work rate test; FFMI, fat-free mass index; HADS, hospital anxiety (A) and depression (D) scale; SGRQ, St. George's Respiratory Questionnaire. CAT (Total, n =1879; Derivation, n =1507; Comparator, n =372), SGRQ (Total, Symptom, Activity, Impact domains: Total, n =716; Derivation, n =566; Comparator, n =150), HADS (Total, n =1833; Derivation, n =1469; Comparator, n =364), 6MWT (Total, n =2018; Derivation, n =1613; Comparator, n =405), CWRT (Total, n =1797; Derivation, n =1431; Comparator, n =366), and FFMI (Total, n =2079; Derivation, n =1654; Comparator, n =425).
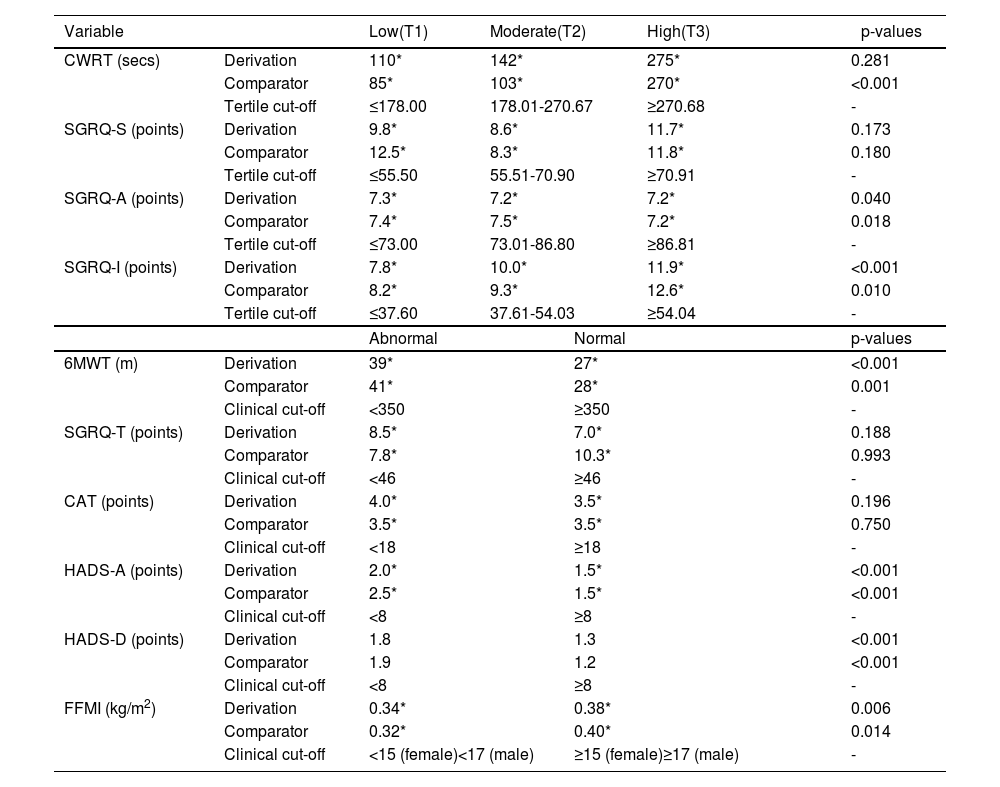
Variation of change on which MIDs were based for CWRT were not significantly different across tertiles for the derivation cohort (p = 0.281) but were for the comparator cohort (p < 0.001). Post-hoc analyses in the comparator cohort showed greater variation of change on which the MID was determined for CWRT in the high (T3) group compared to the moderate (T2) (p = 0.001) and low (T1) (p < 0.001) groups. No significant differences were observed between low (T1) and moderate (T2) groups (p = 0.225).
Variation of change across tertiles on which MIDs were determined for SGRQ-A was evident in both cohorts (p < 0.05). Post-hoc analyses showed greater variation of change on which the MID was determined for SGRQ-A in the low (T1) compared to the high group (T3) (derivation, p = 0.014; comparator, p = 0.016). In the comparator cohort only, the variation of change was greater for determining the MID for SGRQ-A in the moderate (T2) compared to the high (T3) group (p = 0.008). All other tertile comparisons were found to not be statistically significant in the post-hoc analysis (p > 0.0167). Variation of change across tertiles on which MIDs were determined for SGRQ-I was evident in both cohorts (p < 0.05). Post-hoc analyses showed greater variation of change for determining the MID for SGRQ-I in the high (T3) compared to low (T1) (derivation, p < 0.001; comparator, p = 0.003) group. All other tertile comparisons were found to not be statistically significant in the post-hoc analysis (p > 0.0167). No significant differences between tertiles were seen for SGRQ-S in both cohorts (p > 0.05).
Variation of change on which MIDs were determined was evident in people categorised as abnormal according to clinical cut-offs for the outcomes of 6MWT (derivation, p < 0.001; comparator, p = 0.001), HADS-A (both, p < 0.001) and HADS-D (both, p < 0.001) when compared to people categorised as normal in both cohorts. Greater variation of change on which MIDs were determined was seen in people categorised as normal for the outcome of FFMI when compared to people categorised as abnormal in both cohorts (derivation, p = 0.006; comparator, p = 0.014). No significant differences between abnormal and normal baseline scores were seen for CAT and SGRQ-T in either cohort (all, p > 0.05) (Table 3).
MIDs following stratification for baseline outcome values.
| Variable | Low(T1) | Moderate(T2) | High(T3) | p-values | ||
|---|---|---|---|---|---|---|
| CWRT (secs) | Derivation | 110* | 142* | 275* | 0.281 | |
| Comparator | 85* | 103* | 270* | <0.001 | ||
| Tertile cut-off | ≤178.00 | 178.01-270.67 | ≥270.68 | - | ||
| SGRQ-S (points) | Derivation | 9.8* | 8.6* | 11.7* | 0.173 | |
| Comparator | 12.5* | 8.3* | 11.8* | 0.180 | ||
| Tertile cut-off | ≤55.50 | 55.51-70.90 | ≥70.91 | - | ||
| SGRQ-A (points) | Derivation | 7.3* | 7.2* | 7.2* | 0.040 | |
| Comparator | 7.4* | 7.5* | 7.2* | 0.018 | ||
| Tertile cut-off | ≤73.00 | 73.01-86.80 | ≥86.81 | - | ||
| SGRQ-I (points) | Derivation | 7.8* | 10.0* | 11.9* | <0.001 | |
| Comparator | 8.2* | 9.3* | 12.6* | 0.010 | ||
| Tertile cut-off | ≤37.60 | 37.61-54.03 | ≥54.04 | - | ||
| Abnormal | Normal | p-values | ||||
| 6MWT (m) | Derivation | 39* | 27* | <0.001 | ||
| Comparator | 41* | 28* | 0.001 | |||
| Clinical cut-off | <350 | ≥350 | - | |||
| SGRQ-T (points) | Derivation | 8.5* | 7.0* | 0.188 | ||
| Comparator | 7.8* | 10.3* | 0.993 | |||
| Clinical cut-off | <46 | ≥46 | - | |||
| CAT (points) | Derivation | 4.0* | 3.5* | 0.196 | ||
| Comparator | 3.5* | 3.5* | 0.750 | |||
| Clinical cut-off | <18 | ≥18 | - | |||
| HADS-A (points) | Derivation | 2.0* | 1.5* | <0.001 | ||
| Comparator | 2.5* | 1.5* | <0.001 | |||
| Clinical cut-off | <8 | ≥8 | - | |||
| HADS-D (points) | Derivation | 1.8 | 1.3 | <0.001 | ||
| Comparator | 1.9 | 1.2 | <0.001 | |||
| Clinical cut-off | <8 | ≥8 | - | |||
| FFMI (kg/m2) | Derivation | 0.34* | 0.38* | 0.006 | ||
| Comparator | 0.32* | 0.40* | 0.014 | |||
| Clinical cut-off | <15 (female)<17 (male) | ≥15 (female)≥17 (male) | - | |||
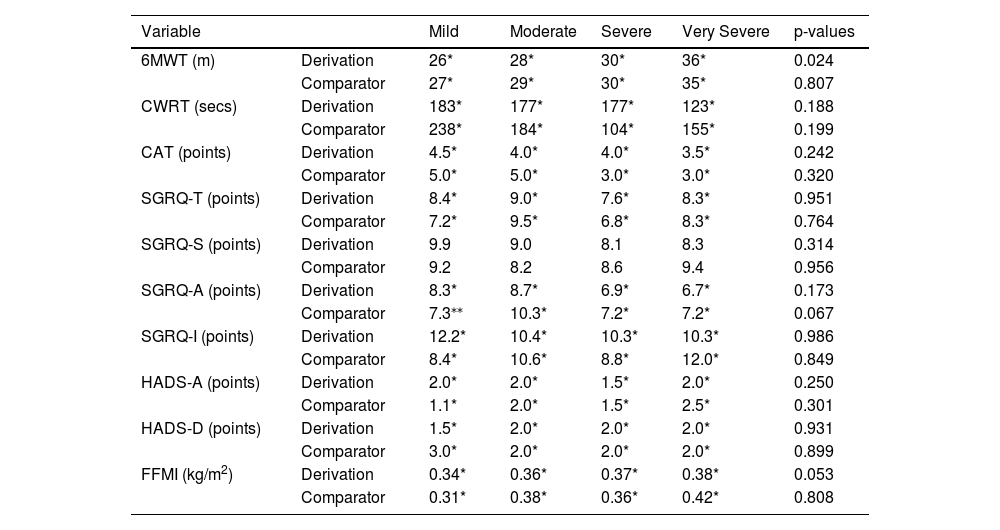
Variation of change on which MIDs were determined across disease severities for the outcome of 6MWT was evident in the derivation cohort only (p = 0.024). Post-hoc analyses showed greater variation of change on which to determine the MID for 6MWT in very-severe COPD when compared to moderate COPD (p = 0.008). No other significant differences were observed between disease severities (p > 0.0167). No significant differences between disease severities were observed in the comparator cohort (p = 0.807).
No significant differences between disease severity groups were seen for CWRT, CAT, SGRQ-T, SGRQ-S, SGRQ-A, SGRQ-I, HADS-A, HADS-D, and FFMI (Table 4).
MIDs following stratification for GOLD severity.
| Variable | Mild | Moderate | Severe | Very Severe | p-values | |
|---|---|---|---|---|---|---|
| 6MWT (m) | Derivation | 26* | 28* | 30* | 36* | 0.024 |
| Comparator | 27* | 29* | 30* | 35* | 0.807 | |
| CWRT (secs) | Derivation | 183* | 177* | 177* | 123* | 0.188 |
| Comparator | 238* | 184* | 104* | 155* | 0.199 | |
| CAT (points) | Derivation | 4.5* | 4.0* | 4.0* | 3.5* | 0.242 |
| Comparator | 5.0* | 5.0* | 3.0* | 3.0* | 0.320 | |
| SGRQ-T (points) | Derivation | 8.4* | 9.0* | 7.6* | 8.3* | 0.951 |
| Comparator | 7.2* | 9.5* | 6.8* | 8.3* | 0.764 | |
| SGRQ-S (points) | Derivation | 9.9 | 9.0 | 8.1 | 8.3 | 0.314 |
| Comparator | 9.2 | 8.2 | 8.6 | 9.4 | 0.956 | |
| SGRQ-A (points) | Derivation | 8.3* | 8.7* | 6.9* | 6.7* | 0.173 |
| Comparator | 7.3⁎⁎ | 10.3* | 7.2* | 7.2* | 0.067 | |
| SGRQ-I (points) | Derivation | 12.2* | 10.4* | 10.3* | 10.3* | 0.986 |
| Comparator | 8.4* | 10.6* | 8.8* | 12.0* | 0.849 | |
| HADS-A (points) | Derivation | 2.0* | 2.0* | 1.5* | 2.0* | 0.250 |
| Comparator | 1.1* | 2.0* | 1.5* | 2.5* | 0.301 | |
| HADS-D (points) | Derivation | 1.5* | 2.0* | 2.0* | 2.0* | 0.931 |
| Comparator | 3.0* | 2.0* | 2.0* | 2.0* | 0.899 | |
| FFMI (kg/m2) | Derivation | 0.34* | 0.36* | 0.37* | 0.38* | 0.053 |
| Comparator | 0.31* | 0.38* | 0.36* | 0.42* | 0.808 | |
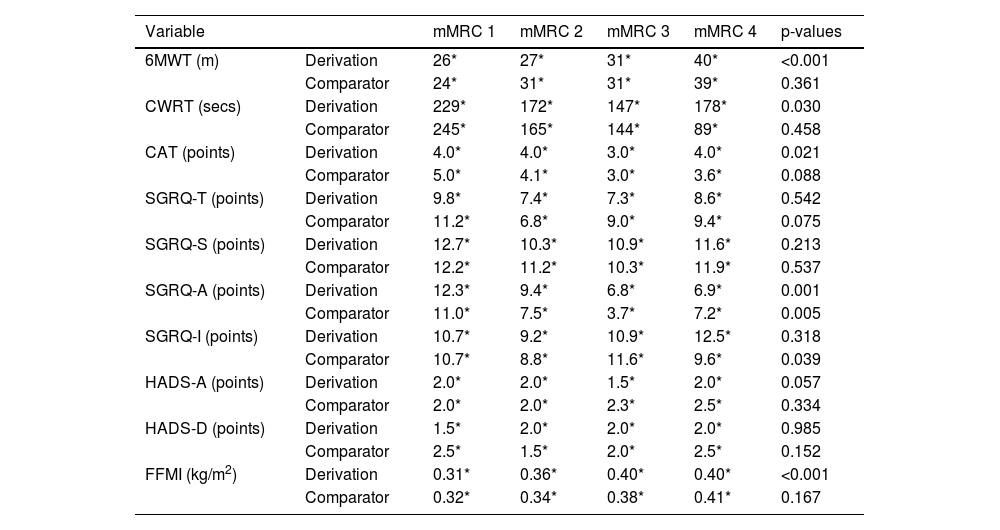
Variation of change on which the MIDs were determined was evident across mMRC scores for 6MWT in the derivation cohort (p < 0.001). Post-hoc analyses showed greater variation of change on which the MID was determined in people with an mMRC of 4 for 6MWT when compared to people with an mMRC of 1 (p < 0.001), mMRC of 2 (p < 0.001), and mMRC of 3 (p = 0.013). Greater variation of change on which the MID was based was also evident in people with an mMRC score of 3 for 6MWT when compared to people with an mMRC of 1 (p = 0.002). No other significant differences were observed between mMRC scores (p > 0.0167). No significant differences between mMRC scores were observed in the comparator cohort.
Variation of change on which the MIDs were determined was evident across mMRC scores for CWRT in the derivation cohort (p = 0.030). Post-hoc analyses showed greater variation of change on which the MID was determined in people with an mMRC of 1 for CWRT when compared to people with an mMRC of 3 (p = 0.013). No other significant differences were observed between mMRC scores (p > 0.0167). No significant differences between mMRC scores were observed in the comparator cohort.
Variation of change on which the MIDs were determined was evident across mMRC scores for CAT in the derivation cohort (p = 0.021). Post-hoc analyses showed greater variation of change on which the MID was determined in people with an mMRC of 1 for CAT when compared to people with an mMRC of 3 (p = 0.007) and mMRC of 2 (p = 0.015). No other significant differences were observed between mMRC scores (p > 0.0167). No significant differences between mMRC scores were observed in the comparator cohort.
Variation of change on which the MIDs were determined was evident across mMRC scores for CAT in both cohorts (derivation, p = 0.001; p = 0.005). Post-hoc analyses showed greater variation of change on which the MID was determined in people with an mMRC of 1 for SGRQ-A when compared to people with an mMRC of 2 (p = 0.011), mMRC of 3 (p < 0.001), and mMRC of 4 (p = 0.002) in the derivation cohort. In the comparator cohort, less variation of change on which the MID was determined was evident in people with an mMRC of 3 when compared to people with an mMRC of 2 (p = 0.010) and mMRC of 1 (p = 0.001). No other significant differences were observed between mMRC scores across derivation and comparator cohorts (p > 0.0167).
Variation of change on which the MIDs were determined was evident across mMRC scores for SGRQ-I in the comparator cohort (p = 0.039). Post-hoc analyses showed greater variation of change on which the MID was determined in people with an mMRC of 3 for SGRQ-I when compared to people with an mMRC of 2 (p = 0.004). No other significant differences were observed between mMRC scores (p > 0.0167). No significant differences between mMRC scores were observed in the derivation cohort.
Variation of change on which the MIDs were determined was evident across mMRC scores for FFMI in the derivation cohort (p < 0.001). Post-hoc analyses showed greater variation of change on which the MID was determined in people with an mMRC of 4 for FFMI when compared to people with an mMRC of 1 (p = 0.002) and mMRC of 2 (p < 0.001). No other significant differences were observed between mMRC scores (p > 0.0167). No significant differences between mMRC scores were observed in the comparator cohort.
No significant differences in MIDs between mMRC groups were seen for SGRQ-T, SGRQ-S, HADS-A, and HADS-D (Table 5).
MIDs following stratification for mMRC.
| Variable | mMRC 1 | mMRC 2 | mMRC 3 | mMRC 4 | p-values | |
|---|---|---|---|---|---|---|
| 6MWT (m) | Derivation | 26* | 27* | 31* | 40* | <0.001 |
| Comparator | 24* | 31* | 31* | 39* | 0.361 | |
| CWRT (secs) | Derivation | 229* | 172* | 147* | 178* | 0.030 |
| Comparator | 245* | 165* | 144* | 89* | 0.458 | |
| CAT (points) | Derivation | 4.0* | 4.0* | 3.0* | 4.0* | 0.021 |
| Comparator | 5.0* | 4.1* | 3.0* | 3.6* | 0.088 | |
| SGRQ-T (points) | Derivation | 9.8* | 7.4* | 7.3* | 8.6* | 0.542 |
| Comparator | 11.2* | 6.8* | 9.0* | 9.4* | 0.075 | |
| SGRQ-S (points) | Derivation | 12.7* | 10.3* | 10.9* | 11.6* | 0.213 |
| Comparator | 12.2* | 11.2* | 10.3* | 11.9* | 0.537 | |
| SGRQ-A (points) | Derivation | 12.3* | 9.4* | 6.8* | 6.9* | 0.001 |
| Comparator | 11.0* | 7.5* | 3.7* | 7.2* | 0.005 | |
| SGRQ-I (points) | Derivation | 10.7* | 9.2* | 10.9* | 12.5* | 0.318 |
| Comparator | 10.7* | 8.8* | 11.6* | 9.6* | 0.039 | |
| HADS-A (points) | Derivation | 2.0* | 2.0* | 1.5* | 2.0* | 0.057 |
| Comparator | 2.0* | 2.0* | 2.3* | 2.5* | 0.334 | |
| HADS-D (points) | Derivation | 1.5* | 2.0* | 2.0* | 2.0* | 0.985 |
| Comparator | 2.5* | 1.5* | 2.0* | 2.5* | 0.152 | |
| FFMI (kg/m2) | Derivation | 0.31* | 0.36* | 0.40* | 0.40* | <0.001 |
| Comparator | 0.32* | 0.34* | 0.38* | 0.41* | 0.167 | |
Due to non-symmetrical distribution, MIDs presented as 0.5 x IQR as opposed to 0.5 x SD. 6MWT, six-minute walk test; CAT, COPD assessment tool; CWRT, constant work rate test; FFMI, fat-free mass index; HADS, hospital anxiety (A) and depression (D) scale; mMRC, modified medical research council dyspnoea scale; SGRQ, St. George's Respiratory Questionnaire.
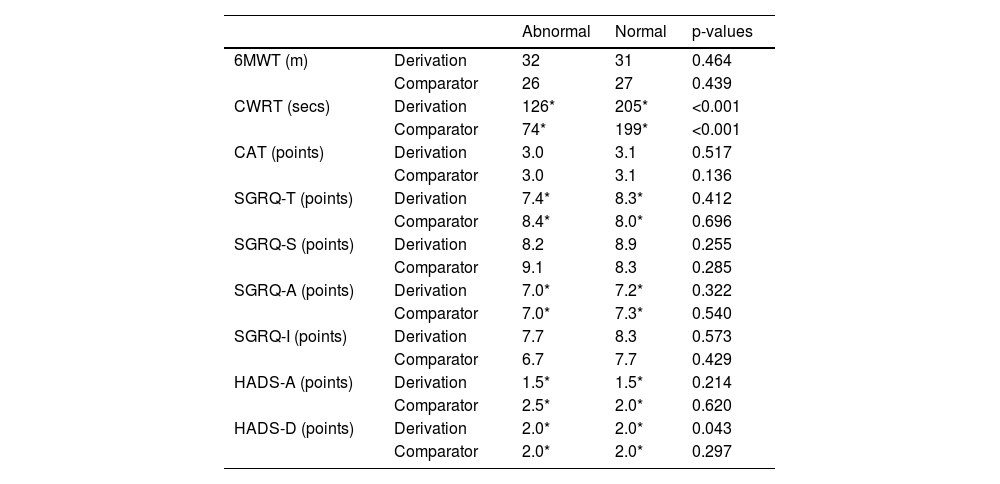
There was greater variation of change on which the MID was determined in people categorised as having normal FFMI for the outcome of CWRT when compared to people categorised as having abnormal FFMI at baseline (derivation, p < 0.001; comparator, p = 0.001) in both cohorts. Greater variation of change on which the MID was determined was seen in people categorised as having abnormal FFMI for HADS-D when compared to people categorised as having normal FFMI at baseline in the derivation cohort (p = 0.043), but not the comparator cohort (p = 0.297). No significant differences between abnormal and normal baseline FFMI groups were seen for 6MWT, CAT, SGRQ-T, SGRQ-S, SGRQ-A, SGRQ-I, and HADS-A in either cohort (all, p > 0.05) (Table 6).
MIDs following stratification for FFMI.
| Abnormal | Normal | p-values | ||
|---|---|---|---|---|
| 6MWT (m) | Derivation | 32 | 31 | 0.464 |
| Comparator | 26 | 27 | 0.439 | |
| CWRT (secs) | Derivation | 126* | 205* | <0.001 |
| Comparator | 74* | 199* | <0.001 | |
| CAT (points) | Derivation | 3.0 | 3.1 | 0.517 |
| Comparator | 3.0 | 3.1 | 0.136 | |
| SGRQ-T (points) | Derivation | 7.4* | 8.3* | 0.412 |
| Comparator | 8.4* | 8.0* | 0.696 | |
| SGRQ-S (points) | Derivation | 8.2 | 8.9 | 0.255 |
| Comparator | 9.1 | 8.3 | 0.285 | |
| SGRQ-A (points) | Derivation | 7.0* | 7.2* | 0.322 |
| Comparator | 7.0* | 7.3* | 0.540 | |
| SGRQ-I (points) | Derivation | 7.7 | 8.3 | 0.573 |
| Comparator | 6.7 | 7.7 | 0.429 | |
| HADS-A (points) | Derivation | 1.5* | 1.5* | 0.214 |
| Comparator | 2.5* | 2.0* | 0.620 | |
| HADS-D (points) | Derivation | 2.0* | 2.0* | 0.043 |
| Comparator | 2.0* | 2.0* | 0.297 | |
To the best of our knowledge, this is the first study in the context of pulmonary rehabilitation in COPD to calculate MIDs for commonly used clinical outcomes based on baseline disease characteristics. Firstly, the present study corroborates previous MID estimates for 6MWT (32m vs 30m18,25), CAT (-3.1 points vs -3.0 to -2.0 points26,27), SGRQ-total (-6.4 points vs -7.43 to -4.0 points6,26), HADS-A (-1.5 points vs -1.8 to -1.3 points27), HADS-D (-2.0 points vs -1.7 to -1.5 points27), and CWRT (170s vs 100-200s28). New MIDs for pulmonary rehabilitation outcomes proposed because of this study include SGRQ-S (-8.7 points), SGRQ-A (-7.1 points), SGRQ-I (-8.1 points), and FFMI (0.36 kg/m2). This is the first study to show that MID estimates differentiate statistically based upon baseline outcome values (6MWT, SGRQ-A, SGRQ-I, HADS-A, HADS-D, FFMI), GOLD disease severity (6MWT), mMRC dyspnoea score (6MWT, CAT, CWRT, SGRQ-A, FFMI), and baseline FFMI (CWRT, HADS-D). SGRQ-T and SGRQ-S MID estimates were not found to be statistically different in terms of variation dependent upon baseline characteristics.
Recently, there has been evidence emerging suggesting that baseline characteristics, in terms of disease, psychological and physical health, have an impact on the magnitude of response to pulmonary rehabilitation in terms of exercise-based and health-related quality of life outcomes.9 It is not implausible to suggest that those with higher baseline exercise capacity and/or better self-reported health-related quality of life might experience a ‘ceiling effect’ in response to any intervention, let alone pulmonary rehabilitation, when such used constructs are restricted to a scoring limit which could lead to less variation in responses seen. Whilst the results reported in this study corroborate previously reported MIDs, this study is the first to demonstrate that MIDs can differ based on baseline characteristics of people with COPD presenting to pulmonary rehabilitation.
In terms of exercise capacity, 6MWT and CWRT did not follow a similar path. The MID for 6MWT was amenable to change dependent upon baseline values and lung function whereas the MID for CWRT was not. However, the MID for CWRT was amenable to change dependent upon baseline FFMI values whereas the MID for 6MWT was not. This study demonstrates for the first time that the MID for 6MWT is statistically higher for people with COPD with heightened disease burden (i.e., low exercise capacity, poorer lung function, heightened dyspnea). Given the MIDs used within this study have been determined by distribution-based methods (i.e., 0.5 x SD or 0.5 x IQR), the higher MID in those with heightened disease burden at baseline for pulmonary rehabilitation reflects greater variation in responses to pulmonary rehabilitation consequently resulting in a higher MID. It was interesting to report the relative stability of the MID for CWRT when accounting for differing disease characteristics, with FFMI and mMRC being the only factors to impact the MID for CWRT. The lack of concordance between 6MWT and CWRT may be attributed to the differing nature of the tests with the 6MWT being a self-paced test where stopping for rest is an option, whilst the CWRT is conducted at a set workload with the test stopped if effort at the set intensity cannot be maintained.
For quality-of-life measures, the MIDs for HADS, CAT and SGRQ domains of activity and impact were amenable to change based upon baseline values. However, this was not the case for SGRQ domains of total score and symptoms. This lack of concordance within the SGRQ suggests a need to examine the tool on both a domain basis, as well as total score. Interestingly, lung function nor mMRC appeared to impact the MIDs for SGRQ or HADS, apart from in the SGRQ-A domain which was impacted by mMRC as was CAT. All MIDs for health-related quality of outcomes remained stable when accounting for baseline FFMI. The lack of differences observed in the SGRQ domains of total and symptoms when accounting for all baseline factors suggests the MIDs for these outcomes are stable across the COPD disease spectrum. However, this was not the case for HADS, CAT and SGRQ domains of activity and impact which need to be assessed on a baseline characteristic dependent level. All in all, as seen with exercise capacity, the observed differences suggested that people with COPD with heightened disease burden (i.e., poorer self-reported quality of life and mood status) had statistically higher MIDs.
In terms of body composition, the MID for FFMI appeared to be amenable to change based on baseline values and dyspnea. The MID for FFMI was higher in those with an mMRC score of 4. In keeping with the other outcomes, people with COPD presenting with poorer health (i.e., lower FFMI) had heightened MIDs. However, people with COPD with higher baseline FFMI had a higher MID. This study for the first time has produced an MID for use with pulmonary rehabilitation for a body composition outcome based on a large dataset.
The most influential factor on MIDs in the context of people with COPD in pulmonary rehabilitation is the baseline values of clinical outcomes. Lung function and mMRC appeared to have a modest impact on the MIDs of certain clinical outcomes but were far less prominent than baseline values themselves. Body composition had little impact on the MIDs of clinical outcomes. Some outcomes, mainly SGRQ-total and symptom domain appeared to have robust MIDs which were not amenable to certain disease characteristics in this large cohort. The 6MWT seemed to be the most consistently amenable outcome to a change in MID based on disease characteristics.
When interpreting the findings of this study, it is important to consider the limitations. Firstly, as far as we are aware there is no comparative literature across diseases which has statistically analysed estimated MIDs dependent upon baseline disease characteristics using a distribution-based approach. We consulted and opted for the Levene's test to measure the variance between clinically relevant cut-offs/tertiles/disease characteristic groups as our MID was based on distribution. It is also worth noting that whilst statistical differences between certain MIDs were seen, it is not possible to determine the clinical relevance of such differences between groups. This combined with the use of a large dataset also increase the possibility of relatively small changes leading to statistically significant differences. However, it is important to note that this study has implications for clinical practice in that MIDs have been produced based on a wide range of disease characteristics allowing service providers to contextualize responses to pulmonary rehabilitation in people with COPD in a variety of different ways which are more relevant to individuals. In turn, these MIDs may also be used in the design of future trials involving pulmonary rehabilitation to assess interventional efficacy through more specified MIDs. This study was not able to include an anchor to weight the changes in outcomes against self-reported improvements. It is important to highlight that there is still ongoing debate as to the accuracy of using differing approaches for estimating the MID.28-32 Due to the large nature of the dataset, there were outcomes which were found to be non-symmetrically distributed which posed challenges for determining the MID based on the standard deviation of data. Therefore, we opted to present a non-parametric equivalent in the form of 0.5 x IQR alongside 0.5 x SD for comparison purposes, and visually, MIDs appeared to be largely similar between approaches. It is important to note that some observations were not replicated in the comparator cohort, and vice versa meaning some results should be interpreted with caution.
In conclusion, this study further confirms the currently available MIDs for the COPD population, whilst also demonstrating that disease characteristics such as baseline outcome values, GOLD disease severity, mMRC score, and baseline FFMI can result in differing MIDs, but not necessarily for all outcomes. The findings suggest a potential need to shift from umbrella MIDs for measuring intervention efficacy with pulmonary rehabilitation and move towards individually tailored MIDs.
Funding informationNot applicable.
We would like to acknowledge the contribution of Dr. Iain Stewart and Dr. Qichen Deng for providing input into the statistical analysis plan.


