


The prediction rules of acute pulmonary embolism(PE) before imaging tests recommended by the commonly used guidelines have low diagnostic efficiency if not combined with D-dimer, therefore it is necessary to seek for a prediction rule with higher diagnostic efficiency.
MethodsWe designed a new score named Legend by synthesizing the scores of Wells, PERC, and Geneva, as well as D-dimer with patients in the development group(n = 2112), and then validated it in patients of validation group(n = 388). Diagnostic efficiency was also compared between Legend score and Wells+D-dimer (DD), PERC+DD, Geneva+DD, and YEARS+DD(YEAR algorithm).
ResultsThe Legend score comprised active cancer, D-dimer≥1000 ng/mL, DVT symptoms and/or signs, previous venous thromboembolism (VTE) history, and surgery, trauma, or immobilization in the past month. The sensitivity, specificity, Youden index, and area under the curve(AUC) were 0.985, 0.744, 0.729, and (0.861[0.796–0.925], P<0.001), respectively, for original Legend score, whereas were 0.982, 0.778, 0.760, and (0.871[0.823–0.920], P<0.001), respectively, for simplified Legend score. The Kappa coefficient and P value of McNemar test were 0.988 and 1.000, respectively, between the original and simplified Legend scores. In the validation group, the sensitivity, specificity, Youden index, and C-index were 0.971, 0.749, 0.720, and (0.838[0.781–0.896], P<0.001), respectively, for the original Legend score, whereas were 0.986, 0.715, 0.701, and (0.816[0.750–0.880], P = 0.001) respectively, for the simplified Legend score. The Kappa coefficient and P value of McNemar test between original Legend score and Wells+DD, PERC+DD, Geneva+DD, and YEARS+DD were (0.563, 0.001), (0.139, <0.001), (0.631, 0.006), and (0.732, 0.029), respectively. The Kappa coefficient and P value of McNemar test between simplified Legend score and aforementioned scores were (0.675, 0.009), (0.172, <0.001), (0.747, 0.001), and (0.883, 0.012), respectively.
DiscussionIn view of the fact the Legend score reserves the efficient predictors and eliminates the inefficient ones in Wells, PERC, and revised Geneva scores, and incorporates D-dimer into it, a more efficient, modified, and user-friendly one has replaced the original ones.
ConclusionsThe Legend score yields excellent diagnostic efficiency with good safety in the pretest prediction of acute PE prior to imaging tests. It also avoids more unnecessary imaging tests than Wells+DD, PERC+DD, Geneva+DD, or YEARS+DD.
Key messages:
What is already known on this topic - The prediction rules of acute pulmonary embolism(PE) before imaging tests recommended by the commonly used guidelines have low diagnostic efficiency provided not combined with D-dimer, it is hypothesized that a new score synthesizing these scores and D-dimer may yield a better efficiency.
What this study adds - A new model termed Legend score comprising active cancer, D-dimer≥1000 ng/mL, DVT symptoms and/or signs, previous VTE history, and surgery, trauma, or immobilization in the past month has yielded excellent diagnostic efficiency with good safety and more reduction of unnecessary imaging tests than Wells+DD, PERC+DD, Geneva+DD, or YEARS+DD, in the pretest prediction of acute PE prior to imaging tests.
How this study might affect research, practice or policy- The results of the present study can provide a new tool for daily clinical practice in the future, and some new ideas for future research in this field.
Acute pulmonary embolism(PE) is a common and potentially fatal disease. PE and/or deep vein thrombosis (DVT) are defined as venous thromboembolism(VTE).1,2 Acute PE is the third most frequent acute cardiovascular disease fractionally behind myocardial infarction and stroke globally.3 For a missed and untreated PE or VTE, the risk of complications comprising life-threatening or fatal PE, chronic thromboembolic pulmonary hypertension, thrombus extension as well as embolization and postthrombotic syndrome increase.4 As such, prompt diagnosis is crucial to provide timely treatment and avoidance of thrombus extension or embolization, PE-related morbidity, and mortality.2,5
Nevertheless, it is not rational to perform imaging tests in everyone suspected with PE, since VTE is frequently suspected whereas only confirmed in 5 % to 10 % of suspected cases who undergo diagnostic evaluation for PE.6,7 Implementing imaging tests of PE in every patient with PE-likely symptoms may result in unnecessary tests with potential complications and waste of medical costs.3 Standard diagnostic strategies for the diagnosis of PE usually comprises 3 steps: estimating the clinical probability of PE first, then conducting D-dimer testing, and finally performing chest imaging tests if indicated.8 In the estimation of clinical probability of PE, the most classic and frequently used prediction rules recommended by the commonly used guidelines and the state-of-the-art authoritative reviews are Wells, pulmonary embolism rule-out criteria (PERC), revised Geneva, and YEARS scores.3,4,5,8
Nonetheless, the diagnostic efficiency for PE in each isolated score is moderate provided that they are not combined with D-dimer level.9,10 Despite this, since all these classic scores were well-designed, long-tested, and widely-acknowledged, suggesting they have justified PE-related risk predictors for the prediction of PE diagnosis, we hypothesize that a synthesis of these scores and D-dimer may yield a better diagnostic efficiency than each individual one of them combined with D-dimer. To date, there have been no such studies available. Therefore, the current study was performed to address this issue.
MethodsStudy designWe designed a new score by synthesizing Wells score, revised Geneva score, PERC score, YEARS score and D-dimer. The Wells score comprises items including previous PE or DVT, rapid heart rate, surgery or immobilization within the past 4 weeks, hemoptysis, active cancer, clinical signs of DVT, and alternative diagnosis less likely than PE.11 The revised Geneva score comprises items including previous PE or DVT, rapid heart rate, surgery or fracture within the past month, hemoptysis, active cancer, unilateral lower-limb pain, pain on lower-limb deep venous palpation and unilateral edema, and old age.12 The PERC rule comprises items including old age, rapid pulse, low oxygen saturation, unilateral leg swelling, hemoptysis, recent trauma or surgery, history of VTE and oral hormone use.13 The YEARS score that derives from the Wells score comprises items including clinical signs of DVT, hemoptysis, and PE is the most likely diagnosis.14 Because of this the YEARS score is totally derived from the Wells score, we actually synthesized Wells score, revised Geneva score, PERC score, and D-dimer. Based on the names of WelLs, PeRC, geneva, and D-dimer, the new one was named “Legend”. After synthesizing the Wells, PERC, Geneva scores, we acquired a total of 10 items including previous PE or DVT, rapid heart rate, surgery, trauma, or immobilization within the past month, hemoptysis, active cancer, clinical signs of DVT, old age, low oxygen saturation, oral hormone use, and PE is the most likely diagnosis.
Previous patients from major medical centers were reviewed if they had undergone diagnostic imaging tests of PE including computed tomography pulmonary angiography (CTPA), and/or planar ventilation/perfusion (V/Q) scanning due to the suspicion of PE by the gestalt of clinicians. The patients with DVT symptoms and/or signs, and patients with objective confirmed PE without DVT symptoms and/or signs also underwent compression ultrasonography(CUS) on lower extremity deep vein to detect DVT. The variables of all 10 items and D-dimer level at the moment of suspicion of PE were adopted in the present study. The item “PE is the most likely diagnosis” was established based on the gestalt of clinicians. All eligible subjects were assigned into development group and validation group in a chronological order. The patients in the development group were all prior to those in the validation group who were the latest ones. The Legend score was derived in the development group and then validated in the validation group.
The first step was to screen out the items which were highly correlated with PE occurrence among the aforementioned 10 items as well as D-dimer. The correlation between all 10 items as well as D-dimer and the occurrence of PE were analyzed among the patients of development group. The second step was to determine the points of each item in the Legend score. We derived two versions of Legend score which were the original and simplified ones, depending on the points of items in the score. The point(s) of items in the original version was designated according to their acquired multivariate Logistic regression coefficients. The item with the minimum odds ratio (OR) was assigned 1 point, whereas the point(s) of other items was the multiples of their OR values over the minimum OR, being rounded to the nearest integer.15,16 By contrast, each item in the simplified version was all allocated 1 point.17,18 The last step was to pinpoint the cutoff value of points in the Legend score. We designed Legend score into a two-level dichotomous prediction rule that comprised a single cutoff for two risk classifications which were PE-likely and PE-unlikely. The cutoff point for the original and simplified versions in Legend score were defined by analyzing the diagnostic efficiency of Legend score for PE occurrence in the patients of development group. In this way the derivation of Legend score was accomplished.
The Legend score was then validated among the patients in the validation group after its derivation. All patients in the validation group were assessed by using Legend score and stratified into PE-likely and PE-unlikely subgroups. According to the actual diagnosis and exclusion of PE, patients in the validation group were also classified into PE and non-PE subgroups. Taking actual PE diagnosis as gold standard, the diagnostic efficiency of original and simplified Legend scores for PE occurrence were both explored among the patients in the validation group. Meanwhile, the diagnostic efficiency of Legend score was compared with that of pretest probability(PTP)-adjusted D-dimer strategy plus the scores of Wells, PERC, revised Geneva, or YEARS(YEARS algorithm), respectively. For Wells and revised Geneva scores, a low PTP with a D-dimer≤1000 ng/mL, or an intermediate PTP with a D-dimer ≤500 ng/mL indicate PE-unlikely, otherwise indicate PE-likely. For PERC and YEARS scores, a negative result by the score with a D-dimer ≤1000 ng/mL, or a positive result by the score with a D-dimer ≤500 ng/mL indicate PE-unlikely, otherwise indicate PE-likely.1,5,7,8
The medical researchers of Shanghai Punan Hospital, Shanghai Xinhua Hospital, and Shanghai Pulmonary Hospital conducted the present study. We retrieved relevant data for analyses from electronic medical record system of each participating hospital. No one who is not an author contributed to the manuscript writing. All authors agreed on the submitted manuscript for publication. Neither patients nor the public were involved in the design, or conduct, or reporting, or dissemination plans of our research. The study protocol was approved by institutional review board of each participating hospital.
Study populationAs per the inclusion and exclusion criteria, eligible patients from each participating hospital were incorporated into the current study. The inclusion criteria comprised: 1) All eligible patients were 18 years old or older; 2) All eligible patients had an objectively confirmed diagnosis or exclusion of PE by undergoing diagnostic imaging tests of PE including CTPA, and/or V/Q scanning when PE was suspected by the gestalt of clinicians. The exclusion criteria comprised: 1) Patients who had an objectively confirmed diagnosis of chronic thromboembolic disease (CTED)3; 2) Patients who underwent anticoagulant or antiplatelet treatment during the investigation of PE.
Statistical analysesWe performed a stepwise binary Logistic regression analysis between the aforementioned 10 items as well as D-dimer and PE diagnosis first, and then conducted a multivariate Logistic regression analysis by using the variables acquired from the stepwise binary Logistic regression analysis, to determine the eligible variables in the Legend score. Such statistical methodology was consistent with those in the previous literature.11,15 Cutoffs of both original and simplified versions of Legend scores were determined by using receiver operator characteristic (ROC) curve analysis, respectively. Diagnostic efficiency was analyzed based on the number of true positive (TP), false positive (FP), false negative (FN), true negative (TN), diagnostic prevalence(DP), and exclusion prevalence(EP). Diagnostic efficiency comprised sensitivity, specificity, positive predictive value (PPV), negative predictive value (NPV), false positive rate (FPR)(misdiagnosis rate), false negative rate (FNR) (missed diagnostic rate), positive likelihood ratio (PLR), negative likelihood ratio (NLR), diagnostic odds ratio (DOR), number needed to diagnosis(NND), success rate (SR)(crude agreement), failure rate(FR), adjusted agreement (AA), Youden index (YI), and Harrell's concordance-index(C-index). Cohen's Kappa coefficient analysis and McNemar test were used for comparison of diagnostic consistency and dominance tests, respectively. Excellent Kappa coefficient was defined as 0.8 < K ≤ 1.0 according to the previous studies.19
We endeavored to acquire as many patients as possible for the sample size of the development group, on the basis of reaching the minimum required sample size for developing a clinical prediction model.20 According to the methods in the article of Riley et al.,20 in the present study, due to the number of candidate predictors being 11, events fraction being 0.5 since the true prevalence of PE was not sure, and root mean square prediction error being 0.05, a total of 1080 patients were required to be measured for developing the Legend score. In the process of determining the sample size of the validation group, having a confidence level of 95 % that the real value was within ±5 % of the measured value, with the patient population proportion being 50 % since the true patient population proportion being suspected for PE was not sure, a total of 385 or more patients were needed to be investigated in the validation of Legend score. Statistical analyses were performed by using SPSS 26. A P-value being less than 0.05 was defined as statistical significance.
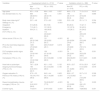
ResultsDemographics and characteristics of patientsWe collected a total of 2714 patients between Jan, 2012, and Dec, 2022 from the participating hospitals who met the inclusion criteria. As per the exclusion criteria, 214 patients were ruled out from the study. In the end, a total of 2500 patients were determined to be the final set. The median age was 68.3 years old. The gender distribution of female and male were 1206 (48.2 %) and 1294(51.8 %), respectively. The number of patients in the development group and validation group were 2112 and 388, respectively. The patients in development group were those between Jan, 2012 and Dec, 2021, whereas those in validation group were those between Jan, 2022 and Dec, 2022. The total prevalence of PE in all patients was 402(16.1 %). The demographics and characteristics of all eligible patients were presented in the Table 1.
Demographics and characteristics of patients.
Note: PE: pulmonary embolism; no.: number; kg/m2 : kilogram/meter2; DVT: deep vein thrombosis; Y/N: yes/no; bpm: beats per minute; VTE: venous thromboembolism; ng/mL: nanogram/milliliter. The prevalence of DVT in Non-PE groups were not presented by reason of that only patients with DVT symptoms and/or signs in it underwent CUS.
In a sequential univariate and multivariate Logistic regression analysis among patients in the development group, the final results indicated that active cancer (1.579[0.666–2.717], P = 0.003), D-dimer≥1000 ng/mL (4.007[1.985–6.242], P<0.001), DVT symptoms and/or signs (3.058[1.517–4.933], P<0.001), previous VTE history (2.874[1.538–4.726], P = 0.001), and surgery, trauma, or immobilization in the past month (3.303[1.566–4.624], P<0.001) were persistently correlated with PE occurrence.(Fig. 1) The present cutoff of D-dimer(1000 ng/mL) were yielded from Logistic regression analysis taking every 500 ng/mL as an unit. A sensitivity analysis by comparing Logistic regression models with all combinations of the 10 items as well as D-dimer demonstrated consistency with the results of the former method. Based on their coefficients, active cancer, D-dimer≥1000 ng/mL, DVT symptoms and/or signs, previous VTE history, and surgery, trauma, or immobilization in the past month were assigned 1, 3, 2, 2, and 2 points in the original Legend score, respectively, whereas assigned all 1 point in the simplified Legend score. By using an ROC curve analysis among the patients in the development group, a total score of 2 or more defined PE-likely, whereas a score of 1 or less defined PE-unlikely, for the original Legend score. For the simplified Legend score, ROC curve analysis revealed that a total score of 1 or more defined PE-likely, whereas a score of 0 defined PE-unlikely. The computational methods of the original Legend score are: add up the score of each item in the original Legend score, then consider PE-likely if the total score is 2 or more, whereas PE-unlikely if it is 1 or less. The computational methods of the simplified Legend score are:add up the score of each item in the simplified Legend score, then consider PE-likely if the total score is 1 or more, whereas PE-unlikely if it is 0. Thus the original and simplified versions of Legend score were established. The models of original and simplified versions of Legend score are demonstrated in Table 2. The comparison of the composition among the Wells, PERC, revised Geneva, YEARS, and Legend scores are displayed in Table 3.

The legend prediction rule for acute PE.
Note: PE: pulmonary embolism; ng/mL: nanogram/milliliter; DVT: deep vein thrombosis; VTE: venous thromboembolism.
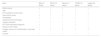
Comparison of composition among Wells, PERC, revised Geneva, YEARS, and Legend scores.
Note: PERC: pulmonary embolism rule-out criteria; DVT: deep vein thrombosis; PE: pulmonary embolism; VTE: venous thromboembolism.
Among 2112 patients in the development group, the actual PE prevalence was 333(15.8 %). The PE-likely and PE-unlikely yielded from original Legend score were 784(37.1 %) and 1328(62.9 %), respectively. Among those PE-likely patients, 328(41.8 %) truly developed PE, whereas 456(58.2 %) did not. Among those 1328 PE-unlikely patients, 1323(99.6 %) truly did not develop PE, whereas 5(0.4 %) actually did. The calibration of PE probability in the risk stratification of PE-likely and PE-unlikely yielded by original Legend score were 41.8 % and 0.4 %, respectively. The TP, FP, FN, TN, sensitivity, specificity, SR, FR, AA, YI, and C-index(area under the curve[AUC]) in the PE pretest prediction by using original Legend score were 328, 456, 5, 1323, 98.5 %, 74.4 %, 78.2 %, 21.8 %, 78.6 %, 0.729, and (0.861[0.796–0.925], P<0.001), respectively.
The PE-likely and PE-unlikely yielded from simplified Legend score were 722(34.2 %) and 1390(65.8 %), respectively. Among those 722 PE-likely patients, 327(45.3 %) truly developed PE, whereas 395(54.7 %) did not. Among those 1390 PE-unlikely patients, 1384(99.6 %) really did not develop PE, whereas 6(0.4 %) actually did. The calibration of PE probability in the risk stratification of PE-likely and PE-unlikely yielded by simplified Legend score were 45.3 % and 0.4 %, respectively. The TP, FP, FN, TN, sensitivity, specificity, SR, FR, AA, YI, and C-index(area under the curve[AUC]) in the PE pretest prediction by using simplified Legend score were 327, 395, 6, 1384, 98.2 %, 77.8 %, 81.0 %, 19.0 %, 80.2 %, 0.760, and (0.871[0.823–0.920], P<0.001), respectively.
In the comparison between two versions of Legend score, the original Legend reduced 1 case of missed diagnosis compared with the simplified one, whereas the simplified Legend reduced 61 cases of unnecessary imaging tests compared with the original one. In the consistency and dominance tests, the Kappa coefficient and P value of McNemar test were 0.988 and 1.000, respectively, between the original and simplified Legend scores. Diagnostic efficiency for PE prior to imaging tests by using original and simplified Legend score in the development group are demonstrated in the Fig. 2.
Diagnostic efficiency of Legend score for PE in the validation group
Among 388 patients in the validation group, the actual PE prevalence was 69(17.8 %). According to the cutoff point of original Legend score, the PE-likely and PE-unlikely were 147(37.9 %) and 241(62.1 %), respectively. Among those 147 PE-likely patients, 67(45.6 %) truly developed PE, whereas 80(54.4 %) did not. Among those 241 PE-unlikely patients, 239(99.2 %) truly did not develop PE, whereas 2(0.8 %) actually did. The calibration of PE probability in the PE-likely and PE-unlikely yielded by original Legend score were 45.6 % and 0.8 %, respectively. The TP, FP, FN, TN, sensitivity, specificity, SR, FR, AA, YI, and C-index in the PE pretest prediction by using original Legend score were 67, 80, 2, 239, 97.1 %, 74.9 %, 78.9 %, 21.1 %, 79.2 %, 0.720, and (0.838[0.781–0.896], P<0.001), respectively.
For the simplified Legend score, the PE-likely and PE-unlikely were 159(41.0 %) and 229(59.0 %), respectively. Among those 159 PE-likely patients, 68(42.8 %) truly developed PE, whereas 91(57.2 %) did not. Among those 229 PE-unlikely patients, 228(99.6 %) truly did not develop PE, whereas one(0.4 %) actually did. The calibration of PE probability in the PE-likely and PE-unlikely yielded by simplified Legend score before imaging tests were 42.8 % and 0.4 %, respectively. The TP, FP, FN, TN, sensitivity, specificity, SR, FR, AA, YI, and C-index in the PE pretest prediction by using simplified Legend score were 68, 91, 1, 228, 98.6 %, 71.5 %, 76.3 %, 23.7 %, 78.1 %, 0.701, and (0.816[0.750–0.880], P = 0.001), respectively.
In the comparison between two versions of Legend score, the simplified Legend reduced 1 case of missed diagnosis compared with the original one, whereas the original Legend reduced 11 cases of unnecessary imaging tests compared with the simplified one. The consistency and dominance tests revealed that the Kappa coefficient and P value of McNemar test were 0.983 and 0.972, respectively, between the original and simplified Legend scores. Compared with Wells+D-dimer(DD), PERC+DD, Geneva+DD, and YEARS+DD, the original Legend score reduced 1, 0, 2, and 1 missed diagnosis, whereas reduced 61, 184, 72, and 79 unnecessary imaging tests.
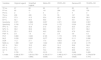
Compared with Wells+DD, PERC+DD, Geneva+DD, and YEARS+DD, the simplified Legend score reduced 2, 1, 3, and 2 missed diagnosis, whereas reduced 50, 173, 61, and 68 unnecessary imaging tests. The consistency and dominance tests between the Legend score and other scores demonstrated that both versions of Legend score were superior to each combination of Wells+DD, PERC+DD, Geneva+DD, and YEARS+DD, respectively. The Kappa coefficient and P value of McNemar test between original Legend score and Wells+DD, PERC+DD, Geneva+DD, and YEARS+DD were (0.563, 0.001), (0.139, <0.001), (0.631, 0.006), and (0.732, 0.029), respectively. The Kappa coefficient and P value of McNemar test between simplified Legend score and Wells+DD, PERC+DD, Geneva+DD, and YEARS+DD were (0.675, 0.009), (0.172, <0.001), (0.747, 0.001), and (0.883, 0.012), respectively. Diagnostic efficiency for PE prior to imaging tests by using original and simplified Legend score as well as other scores combined with PTP-adjusted D-dimer in the validation group are demonstrated in Table 4.
Comparison of diagnostic efficiency for PE between Legend and other Scores in Validation Group.
Note: PE: pulmonary embolism; DD: D-dimer; PERC: pulmonary embolism rule-out criteria; no.: number; TP: true positive; FP: false positive; FN: false negative; TN: true negative; DP: diagnostic prevalence; EP: exclusion prevalence; PPV: positive predictive value; NPV: negative predictive value; FPR: false positive rate; FNR: false negative rate; PLR: positive likelihood ratio; NLR: negative likelihood ratio; DOR: diagnostic odds ratio; NND: number needed to diagnosis, SR: success rate; FR: failure rate; AA: adjusted agreement: YI: Youden index; C-index: concordance-index.
In the present study, we devised a novel prediction rule termed Legend to predict the likelihood of PE diagnosis prior to imaging tests. The Legend score is the synthesis of Wells score, PERC score, revised Geneva score, and D-dimer, which are all endorsed by guidelines.3,4,5,8 In the current study, the original and simplified versions of Legend score both demonstrated excellent diagnostic efficiency before imaging tests for PE, better than the combination of PTP-adjusted D-dimer strategy with Wells, PERC, revised Geneva, or YEARS scores, respectively. There was no significant disparity with regard to diagnostic efficiency for PE between the original and simplified versions of Legend score. To the best of our knowledge, this is the first time that the scores of Wells, revised Geneva, and PERC, as well as D-dimer have been synthesized and validated, by contrast with Wells+DD, PERC+DD, Geneva+DD, and YEARS+DD. No comparable studies are available to date.
First of all, the patient population in the development group covered patients suspected with PE from departments of outpatient, emergency, and inpatient, in tertiary and secondary hospitals, respectively. The prevalence of PE in the development group was slightly higher than the low probability of PE (<15%), whereas it was almost the least in the range of moderate probability of PE (15%−40%).8 It was also basically consistent with the average PE prevalence(14.9%) across different healthcare settings in the previous studies,21 albeit higher than that in the pulmonary embolism graduated D-dimer (PEGeD) Study7 (7.4 %) and the study of Freund et al.6(7.1 %). It is worth noting that the study population in the PEGeD Study7 was just outpatients, whereas that in the study of Freund et al.6 was only emergency patients. As such, the derivation of Legend score in the development group makes it possible for its generalized application in the clinical settings of outpatient, emergency, and inpatient, of tertiary and secondary hospitals.
In a meta-analysis that assessed the capability of ruling out PE by the diagnostic strategies of PERC, Wells, revised Geneva, and YEARS among over 35,000 patients suspected of PE(average PE prevalence:14.9 %) from 23 studies,21 the sensitivity of Wells + PTP-adjusted DD ranged from 93.25 % to 97.11 %, whereas its specificity ranged from 39.50 % to 67.40 %. The sensitivity of revised Geneva + PTP-adjusted DD ranged from 94.18 % to 95.73 %, whereas its specificity ranged from 37.29 % to 54.49 %. The sensitivity of YEARS + PTP-adjusted DD ranged from 96.15 % to 98.20 %, whereas its specificity ranged from 35.83 % to 60.55 %. There was no data for PERC + PTP-adjusted DD since such a combination was seldom used. The sensitivity and specificity of Wells + PTP-adjusted DD, revised Geneva + PTP-adjusted DD, and YEARS + PTP-adjusted DD in the previous studies are basically consistent with those in the present study, whereas are inferior to the original and simplified Legend scores especially with respect to specificity, respectively. In a single-center retrospective cohort study from a public hospital in New York City, a D-dimer cutoff of 500 ng/mL or an age-adjusted D-dimer cutoff combined with Wells, YEARS, or revised Geneva scores had significant diagnostic value in ruling out PE among 917 patients with suspected PE(PE prevalence:13.9%) in emergency department and general floors, respectively.22 By comparison, the Youden index and AUC of the diagnostic strategies in this single-center study are all inferior to those of the original or simplified Legend scores in the current study, respectively, albeit being similar to those of Wells, YEARS, and Geneva in the current study. Of note, the patient population in this single-center study may have a low clinical probability or risk of PE according to the previous literature8. In addition, the nature of the single-center study and a relatively small sample size may affect the results of the study of Kharawala et al. to a certain degree.
With respect to the structure of Legend score, it reserves the efficient predictors and eliminates the inefficient ones among all the items in Wells, PERC, and revised Geneva scores, by adding D-dimer into it, thereby shaping a more efficient, modified, and user-friendly one, compared with the original ones. The items in Legend score comprise medical history including previous VTE history, active cancer, and recent surgery, trauma, or immobilization, symptoms and/or signs including DVT, and laboratory tests results including D-dimer. Legend score inherits the items which are objective, steady, and highly PE-related, whereas abandons those subjective, unsteady, and less PE-related ones that may interfere with the accuracy of PE estimation, from Wells, PERC, and revised Geneva scores. Active cancer, DVT symptoms and/or signs, previous VTE history, recent surgery, trauma, or immobilization, and D-dimer are all generally acknowledged risk factors in PE prediction rules before imaging tests endorsed by all guidelines. Their importance goes without saying, and cannot be overstated. In the present study, the aforementioned factors were more vital than age, heart rate or pulse, hemoptysis, ongoing hormonal therapy, oxygen saturation, and PE is the most likely diagnosis, albeit these latter factors are also included in previous prediction rules of PE.
Increasing age is just a weak risk factor for VTE or PE.3 In the Study on the Clinical Course of Pulmonary Embolism (SCOPE), age was also irrelevant with VTE recurrence.23 Heart rate or pulse is a dynamically changing variable. Time-domain heart rate variability (HRV) parameters are risk factors for RV overload as well as risk classification in acute PE.24 As such, heart rate or pulse may be not a reliable parameter in the risk score for PE. Notwithstanding the presence of hemoptysis in all the scores of Wells, PERC, revised Geneva, and YEARS, in a post hoc analysis to evaluate the impact of removing the item of “hemoptysis” from the PERC, YEARS, and PEGeD clinical decision rules in two European prospective cohorts, the results indicated that hemoptysis could be safely removed from the PERC, YEARS, and PEGeD.25 With respect to hormonal therapy that is mainly specific to women in certain age, a population-based case-control study covering 1,771,253 women aged 40–69 years revealed that, the risk of PE significantly increased mainly in users of oral instead of transdermal menopausal hormone therapy (MHT), as well as in first ever users. The PE risk was considerably lower in women with recurrent MHT treatment.26 Accordingly, the significance of ongoing hormonal therapy may be compromised in the risk score for PE. Oxygen saturation that is also unsteady is only incorporated into the PERC rule,13 and is not regarded as a highly-related risk factor for PE.3 It was not significantly correlated with PE occurrence in the present study either. The item of “PE is the most likely diagnosis” is all along controversial, since this one involves uncontrollable subjective factors. A prospective cohort study suggested that clinicians should adopt explicit clinical models in the diagnostic management of patients with suspected PE, due to the insufficient interobserver reliability of PTP assessment by overall impression or gestalt.27 In a recent authoritative review of VTE, revised Geneva score that does not incorporate “pulmonary embolism is the most likely diagnosis ” is favored over Wells or YEARS score.1 The revised Geneva score is also highly recommended by European Society of Cardiology (ESC) guidelines.3 The present study revealed that “pulmonary embolism is the most likely diagnosis” was not significantly correlated with actual PE occurrence.
From the perspective of clinical implications, the present study contributes a new tool to the field of predicting PE likelihood prior to imaging tests. The C-index of both original and simplified versions of Legend score being more than 0.80 suggest excellent diagnostic efficiency.9 During the derivation of Legend score, the failure rate of missing a PE ranged from 1.5 % to 1.8 %, which fell in the safety range (PE missing less than 2.0 %) for a PE diagnostic strategy suggested by the scientific and standardization committee of the International Society on Thrombosis and Hemostasis.28 The innovative and neoteric Legend score yields better diagnostic efficiency than any combination of PTP-adjusted D-dimer strategy with Wells, PERC, revised Geneva, or YEARS scores, despite Legend is derived by synthesizing them. In addition, the Legend score avoid more unnecessary imaging tests compared with Wells+DD, PERC+DD, Geneva+DD, and YEARS+DD, respectively. On the other hand, with respect to user-friendliness, Legend score is also superior to each individual one of Wells+DD, PERC+DD, Geneva+DD, or YEARS+DD. In view of the similar PE diagnostic efficiency between the original and simplified Legend scores, the latter is preferred due to its better user-friendliness, convenience, and rapidity in daily clinical practice, especially in settings like emergency department which need rapid response from clinicians.
It is necessary to acknowledge several limitations in the present study. First, the Legend score was yielded and validated retrospectively in the present study. The external prospective validation for its reliability is warranted in the future. Second, heterogeneity may exist in the present patient population that consisted of outpatients, inpatients, and emergency patients. Nevertheless, subgroup analysis revealed the consistency of diagnostic efficiency of Legend score among different subgroups of development and validation groups. Third, since we only adopted PTP-adjusted D-dimer strategy which is endorsed by ESC guidelines3 and authoritative reviews5,8 in the combination with Wells, PERC, revised Geneva, and YEARS scores in the present study, results may have been different if we adopted other D-dimer strategies such as age-adjusted D-dimer1,3,5,8. In addition, the Wells and revised Geneva scores adopted in the present study were both simplified version due to their convenience in daily clinical practice,3 results may have been different if we adopted their original version. Last but not least, since the present study did not include patients from primary healthcare, the Legend score may not be applicable to such patient population.
In conclusion, we synthesized Wells score, PERC score, revised Geneva score, and D-dimer which are all recommended by the commonly used guidelines into a new score termed as Legend, in the present study. The Legend score yields excellent diagnostic efficiency in the pretest prediction of acute PE prior to imaging tests, superior to those of Wells+DD, PERC+DD, Geneva+DD, or YEARS+DD. Besides good safety, it avoids more unnecessary imaging tests than Wells+DD, PERC+DD, Geneva+DD, or YEARS+DD. The findings of present study may provide some new clues for the improvement of clinical diagnosis model of pulmonary embolism.
The authors declare no competing interests.


