
The incremental shuttle walk test (ISWT) is one of the most widely used field tests to assess cardiorespiratory fitness in clinical and research settings. Reference equations to predict ISWT distance in different populations and age cohorts have been established. However, an equation for the Portuguese pediatric population is not available. This study aimed to develop a reference equation for predicting ISWT in Portuguese children and adolescents.
MethodHealthy children and adolescents aged between 5 and 17 years old were recruited. Sociodemographic (sex, age), anthropometric (height, weight) and physical activity (Physical Activity Index) data were collected. Lung function was assessed through spirometry and quadriceps muscular strength through hand-held dynamometry. The ISWT was performed twice. A reference equation was established with a multiple linear regression.
Results130 (60 male; 13.66±2.61y) participants with normal lung function (forced expiratory volume in one second 102.73±15.09% predicted), body mass index (BMI) (20.27±3.59kg/m2) and quadriceps muscular strength (19.75±6.84kgf), completed the assessment. 50.8% (n=66) of the participants were moderately active. Participants walked on average 1165.08±327.19m in the ISWT. Sex, age and BMI were independent contributors to the ISWT, explaining 54% of its variability (p<0.001). The derived reference equation was: ISWT=342.06+(283.07×sex)+(83.61×age)−(22.22×BMI), with female=0 and male=1.
ConclusionSex, age and BMI were found to be contributors to the ISWT predictive equation for pediatric population, providing a simple reference to assess their cardiorespiratory fitness.
The incremental shuttle walk test (ISWT) was developed by Singh and colleagues in 1992, with the aim of evaluating cardiorespiratory fitness in adult patients with chronic obstructive pulmonary disease.1 The ISWT is based on the distance walked around a 10m course according to different speeds dictated by an audio signal.2 The incremental nature of the ISWT stresses the cardiopulmonary system and generates a physiological response to exercise,3 replicating in the field, a similar response to an incremental cardiopulmonary exercise test.2 This test is easy to administer, not expensive4,5 and has been found to be a predictor of mortality and morbidity in patients with chronic respiratory diseases.6–8 The ISWT has been used as an outcome measure to assess the effectiveness of interventions in a variety of health conditions, age groups and in both research and clinical settings.2 Nevertheless, its use to assess cardiorespiratory fitness in the pediatric population has been somewhat limited, mainly due to the absence of reference values for healthy children and adolescents. These values are crucial to provide comparative data for those living with a disease. Whilst for adults (from 18 to 90 years old), a number of reference values and reference equations for predicting and interpreting ISWT distance are available3,9–12; for the pediatric population, only one study has published a ISWT reference equation.13 In this study, sex, age and body mass index were found to be predictive factors for the ISWT.13 However, the study was conducted in children and adolescents from Brazil, and the normative values found may not be directly applicable to children with different ethnic, environmental and geographical backgrounds. Thus, there is a need to establish normative values generated and verified in the local population, compatible with its characteristics.2
Therefore, the aim of this study was to establish normative values and a reference equation for predicting the ISWT in Portuguese healthy children and adolescents.
MethodsStudy design and participantsA cross-sectional study with healthy children and adolescents was conducted between June 2013 and March 2016. Participants were recruited from two schools in the central region of Portugal. Ethical approval was obtained from the Ethics Committee of the Research Unit of Health Sciences at the School of Nursing in Coimbra, Portugal (P186-10/2013 & P 246-12/2014). Authorization to conduct the study in each school was obtained from the school boards.
Children and adolescents were eligible if: (i) aged 5–17 years old; (ii) had no chronic or acute disease; (iii) understood the study aims and accepted to participate. Exclusion criteria included: (i) presence of neurological impairment or significant cardiopulmonary and/or musculoskeletal disorders and (ii) any other significant contraindication that could affect physical tests performance. Prior to any data collection, written informed assent was obtained from children and adolescents and written informed consent from their legal representatives. The aim of the study was explained to legal representatives, at the time of the signing of consent form and they were asked about the health status of their child, specifically the presence of any acute or chronic disease.
Data collection proceduresSocio-demographic (sex and age) and anthropometric (weight and height) data were first collected to characterize the sample. A questionnaire to characterize the level of physical activity was also completed. A spirometry test was performed to ensure that participants had normal lung function. Then, quadriceps muscle strength was measured. Finally, two ISWT were performed.
Physical activity levelPhysical activity levels were assessed using the Physical Activity Index (PAI).14 The PAI is composed of 5 questions and the answers are scored in a Likert scale from 1 to 4 points. Final score ranges from 5 to 20 points, and can be divided into 4 categories: sedentary, lightly active, moderately active and vigorously active.14 This questionnaire has been validated to the Portuguese population,14,15 demonstrating excellent test-retest reliability (intraclass correlation coefficient=0.92–0.96) and good internal consistency (Cronbach's alpha=0.87).15
Lung functionA spirometric test using a portable spirometer (MicroLab 3500, CareFusion, Kent, UK) was performed as recommended by the American Thoracic Society/European Respiratory Society.16 Spirometry is a simple and non-invasive test and it is indicated to assess health status before vigorous exercise to identify the presence of restrictive or obstructive respiratory abnormalities.17
Quadriceps muscle strengthQuadriceps maximum isometric muscle strength was assessed using a hand-held dynamometer (Hoggan MicroFET2 Muscle Tester, Model 7477, Pro Med Products, Atlanta, GA) because it is easy to use and portable.18 During the test, participants were sitting on a chair, with the knee flexed to 90°, hip flexion 90° and straight trunk. The hand-held dynamometer was placed on the anterior surface of the dominant leg, proximal to the ankle (5cm above lateral malleolus). All measurements were taken in kilogram of force (kgf). Each participant performed at least one practice trial to understand the movement and acceptable stabilization. Then, two trials, of ten seconds contraction each, were performed; there was a resting period of 60s between trials. The mean of the 2 trials was considered for analysis.19
Cardiorespiratory fitnessThe ISWT protocol was followed as described by Singh et al.1 and Probst et al.12 The ISWT is an externally paced maximal exercise test, controlled by pre-recorded signals that command the walking speed.10 The walking speed increases 0.17m/s each minute, starting at 0.5m/s, until the participant can no longer carry on with the test. In this study, the audio signals continued until individuals reached their maximal effort, exceeding the 12 levels of speed recommended by Singh et al.1 This proposed adaptation has been previously used to predict ISWT reference values in healthy individuals (i.e., children, adolescents and adults)12,13 and was needed to reach individual symptom limited maximal performance and avoid a ceiling effect, considering that participants were healthy and could possibly reach more than the 12th level to get to their maximal performance.12 A brief standard explanation about the test was provided by an audio recording prior to trial.2 Participants were instructed to walk between the two markers at the time ordered by audio signals for as long as possible until they were too breathless or could not achieve the distance within the beep time two consecutive times. If at some point, they lagged behind the pace dictated by the audio-signal, but felt they were not at their symptom limited maximal performance, a standardized warning was given and running was allowed.12,13 The ISWT was performed twice due to the associated learning effect and the best result was considered for analysis.4,20 At least 30min of rest was provided between the two tests. The distance (in meters), the level and the number of shuttles achieved were recorded. If the test was ended the reason was registered.
To ensure proper participant inclusion and safety during the study, physiological responses to ISWT performance such as dyspnea, fatigue, heart rate, peripheral oxygen saturation, arterial blood pressure and respiratory rate were monitored before and after the two ISWTs.17 Dyspnea and fatigue were measured on the modified Borg Scale.21 The heart rate and peripheral oxygen saturation were measured by a pulse oximeter (PULSOX-300i, Konica Minolta Sensing, Inc., Osaka, Japan) on the non-dominant hand indicator and arterial blood pressure with a blood pressure monitor (Elite, Medel, Parma, Italy). The ISWT is a valid and reliable test when assessing maximal exercise capacity in individuals with chronic respiratory diseases.20,22 Previous research has shown that the ISWT is a reproducible and valid measure for assessing the function-limited aerobic capacity in children with cystic fibrosis (6–16 years).23
Statistical analysisThe sample size for multiple linear regression to establish reference equations was determined according to the ‘rule of thumb’ by Green24: N≥50+8m where N is the sample size and m is the number of independent variables. As 3 independent variables were considered, a minimum of 74 participants were required.
Data were analyzed using IBM SPSS Statistics version 24 (SPSS Inc., Chicago, Illinois, IL) and plots were created using GraphPad Prism 5.01 (GraphPad Software, La Jolla, California). Descriptive statistics were first applied to characterize the sociodemographic and anthropometric data, PAI score, lung function and quadriceps muscle strength and the ISWT. The predicted maximal heart rate (HR max) for each participant was calculated according to the formula 206.9−(0.67×age), recommended to reflect the differences in heart rate according to age.25 The normality of data distribution was assessed with Kolmogorov–Smirnov tests.26
The intraclass correlation coefficient (ICC) and Bland–Altman plots were used to assess the relative and absolute reliability of the ISWT.27 ICC was interpreted as excellent (>0.75), moderate to good (0.4–0.75) or poor (<0.4).28
Pearson correlation coefficients (age, weight, height, BMI, % HR max, physical activity level, quadriceps muscle strength and FEV1% predicted) and point-biserial correlation coefficient (sex) were used to measure the strength of association between these variables and the distance achieved during the ISWT. These correlations tests were used to select independent variables for the multiple regression analysis.
A model of multiple linear regression, using the Enter mode, was used to estimate the best predictor model for the ISWT distance. ISWT was the dependent variable and variables with significant correlations were included as independent variables. The assumptions of linearity, independence of errors, homoscedasticity, unusual points and normality of residuals were analyzed. ANOVA and R-squared (R2) were used to assess the performance of the model.
To assess the reliability of the equation, measured ISWT distances were compared with the values obtained from a previously published equation13 using a paired-samples t-test. Pearson correlation coefficient and Bland and Altman plot were also used. The level of significance considered was set at p<0.05.
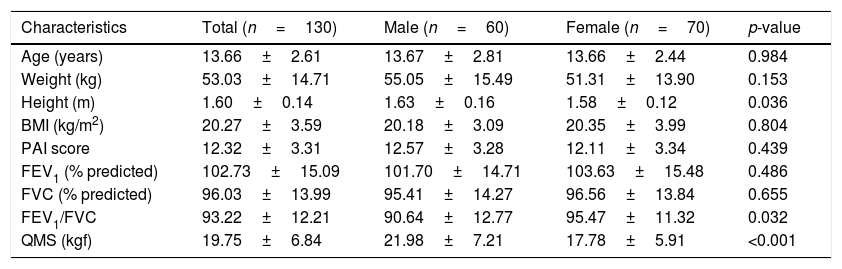
ResultsParticipants’ characteristicsA total of 135 subjects were selected, but 2 had abnormal lung function, 2 failed to obtain the signed consent forms from their legal representatives and 1 could not complete the assessment due to lack of time. A total of 130 children/adolescents were recruited (60 male) and completed the assessment. Detailed participant characterization is summarized in Table 1. Participant mean age was 13.66±2.61 years old. Most participants had a normal BMI (n=78; 60%) and lung function (FEV1=102.73±15.09% predicted). Based on the PAI score, 50.8% of the participants (n=66) were moderately active.
Characteristics of the sample (n=130).
| Characteristics | Total (n=130) | Male (n=60) | Female (n=70) | p-value |
|---|---|---|---|---|
| Age (years) | 13.66±2.61 | 13.67±2.81 | 13.66±2.44 | 0.984 |
| Weight (kg) | 53.03±14.71 | 55.05±15.49 | 51.31±13.90 | 0.153 |
| Height (m) | 1.60±0.14 | 1.63±0.16 | 1.58±0.12 | 0.036 |
| BMI (kg/m2) | 20.27±3.59 | 20.18±3.09 | 20.35±3.99 | 0.804 |
| PAI score | 12.32±3.31 | 12.57±3.28 | 12.11±3.34 | 0.439 |
| FEV1 (% predicted) | 102.73±15.09 | 101.70±14.71 | 103.63±15.48 | 0.486 |
| FVC (% predicted) | 96.03±13.99 | 95.41±14.27 | 96.56±13.84 | 0.655 |
| FEV1/FVC | 93.22±12.21 | 90.64±12.77 | 95.47±11.32 | 0.032 |
| QMS (kgf) | 19.75±6.84 | 21.98±7.21 | 17.78±5.91 | <0.001 |
Data are presented as mean±SD. BMI: body mass index; FEV1: forced expiratory volume in one second; FVC: forced vital capacity; PAI: Physical Activity Index; QMS: quadriceps muscular strength.
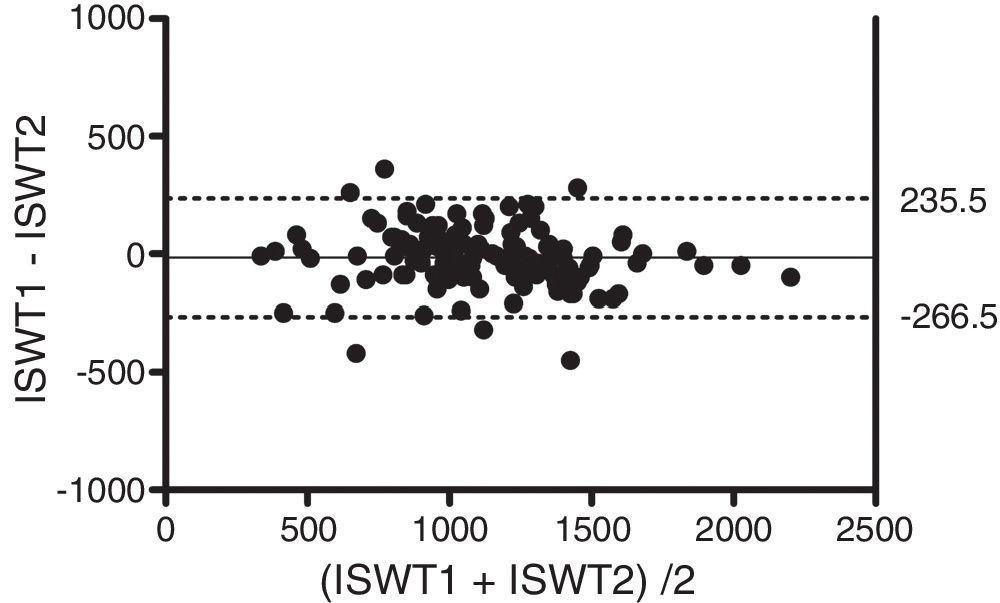
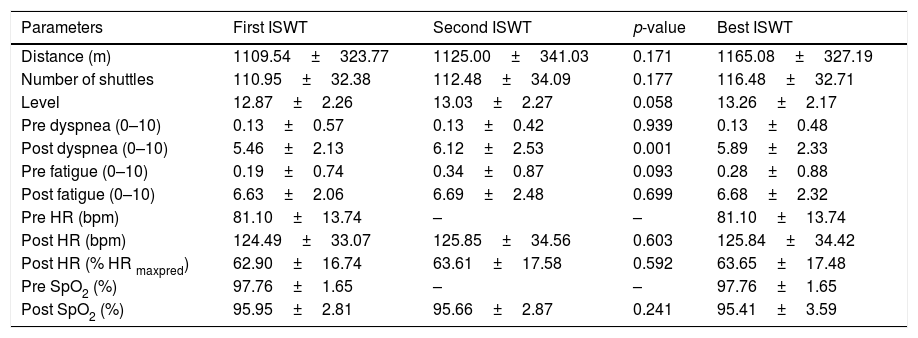
This section presents the outcomes of the first, second and best ISWT and the respective physiological responses. The first and second ISWT were not significantly different (p=0.171) and were strongly correlated (r=0.93; p<0.001). Excellent relative reliability was found between the two ISWT performed (ICC=0.93; 95% CI 0.90–0.95). Bland–Altman plot showed no systematic bias, with a mean difference of −15.5m (95% limits of agreement −266.5 to 235.5) (Fig. 1). The best mean distance achieved during the ISWT was 1165.08±327.19m. Males reached significantly longer distances than females (1319.33±359.78 vs 1032.86±225.90; p<0.001) (Table 2).
.")
Outcome parameters of the first, second and best ISWT (n=130).
| Parameters | First ISWT | Second ISWT | p-value | Best ISWT |
|---|---|---|---|---|
| Distance (m) | 1109.54±323.77 | 1125.00±341.03 | 0.171 | 1165.08±327.19 |
| Number of shuttles | 110.95±32.38 | 112.48±34.09 | 0.177 | 116.48±32.71 |
| Level | 12.87±2.26 | 13.03±2.27 | 0.058 | 13.26±2.17 |
| Pre dyspnea (0–10) | 0.13±0.57 | 0.13±0.42 | 0.939 | 0.13±0.48 |
| Post dyspnea (0–10) | 5.46±2.13 | 6.12±2.53 | 0.001 | 5.89±2.33 |
| Pre fatigue (0–10) | 0.19±0.74 | 0.34±0.87 | 0.093 | 0.28±0.88 |
| Post fatigue (0–10) | 6.63±2.06 | 6.69±2.48 | 0.699 | 6.68±2.32 |
| Pre HR (bpm) | 81.10±13.74 | – | – | 81.10±13.74 |
| Post HR (bpm) | 124.49±33.07 | 125.85±34.56 | 0.603 | 125.84±34.42 |
| Post HR (% HR maxpred) | 62.90±16.74 | 63.61±17.58 | 0.592 | 63.65±17.48 |
| Pre SpO2 (%) | 97.76±1.65 | – | – | 97.76±1.65 |
| Post SpO2 (%) | 95.95±2.81 | 95.66±2.87 | 0.241 | 95.41±3.59 |
Data are presented as mean±SD. HR: heart rate; % HR maxpred: percentage of HR maximum predicted; SpO2: peripheral oxygen saturation.
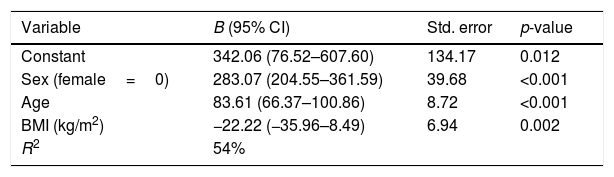
The assumptions of linearity, independence of errors, homoscedasticity, unusual points and normality of residuals were verified. Using a multiple linear regression, it was found that sex, age and BMI were statistically significant predictors of the ISWT (ANOVA p<0.001) and together explained 54% of their variability. Unstandardized regression coefficients (B), 95% confidence intervals and standard errors of the coefficients are presented in Table 3.
Summary of multiple regression analysis for ISWT distance as dependent variable.
| Variable | B (95% CI) | Std. error | p-value |
|---|---|---|---|
| Constant | 342.06 (76.52–607.60) | 134.17 | 0.012 |
| Sex (female=0) | 283.07 (204.55–361.59) | 39.68 | <0.001 |
| Age | 83.61 (66.37–100.86) | 8.72 | <0.001 |
| BMI (kg/m2) | −22.22 (−35.96–8.49) | 6.94 | 0.002 |
| R2 | 54% |
BMI: body mass index.
Based on the multiple linear regression model, the equation to predict ISWT was: ISWT predicted=342.06+(283.07×sex)+(83.61×age)− (22.22×BMI), with female=0 and male=1.
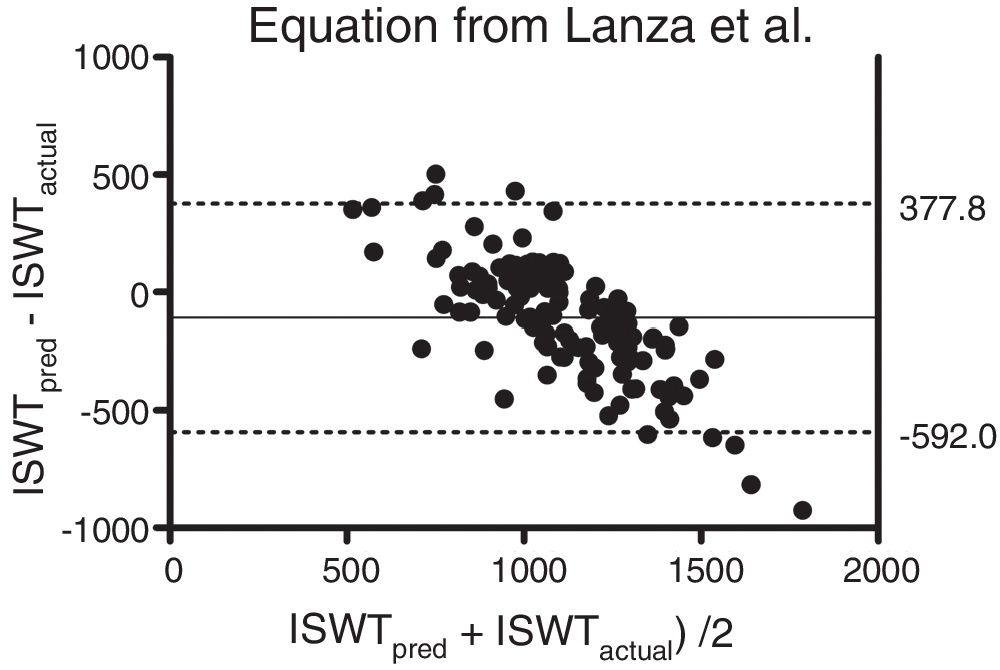
There was a significant difference between the actual ISWT and the predicted ISWT calculated with the equation established by Lanza et al. (1165.1±327.2 vs. 1058±152.6; p<0.001). A moderate correlation was found between these two values (r=0.69; p<0.001). The Bland & Altman plot also showed poor agreement and large limits of agreement between the actual ISWT and the predicted ISWT obtained with the equation established by Lanza et al.13 (mean difference – 107.1m) (Fig. 2).
 value of the ISWT plotted against the mean of the actual and the predicted value of the ISWT. The bold line represents the mean difference and the dotted lines the 95% limits of agreement.")
Bland & Altman plot of the difference between the actual and the predicted (from the equation established by Lanza et al.13) value of the ISWT plotted against the mean of the actual and the predicted value of the ISWT. The bold line represents the mean difference and the dotted lines the 95% limits of agreement.
The present study established a predictive equation for the ISWT distance in healthy Portuguese children and adolescents. Sex, age and BMI were included in this predictive equation, explaining 54% of the variance in the ISWT distance.
Excellent reliability was found between the two ISWT performed, which is consistent with the previous study published on the pediatric population.13 Results of our study demonstrated that the mean ISWT distance for healthy Portuguese children and adolescents aged 5–17 years old was 1165.08±327.19m, presenting large variability (340–2250m). This variability can be explained by the different demographic and anthropometric characteristics of our sample, such as age, sex, height, weight, physical activity levels and peripheral muscle strength.29 Large variability in the ISWT has also been reported in healthy children and adolescents (aged 6–18 years old)13 and healthy adults (aged 18–83 years old).12 Other possible explanations of the variability of the performance are, the state of maturity related to pre/post pubertal status, the day of measurement (weekday or weekend) and socioeconomic status,30 however, in the present study these aspects were not evaluated.
Some of the variables of the proposed equation to predict the ISWT have been previously used in equations developed for healthy Brazilian children/adolescents,13 adults12 and healthy British adults10 and presented similar coefficients of determination (48%, 50% and 71%, respectively).3,9,11,12 Our findings showed that boys (1319.33±359.78) reached longer distances than girls (1032.86±225.90). In studies establishing pediatric reference equations for the 6MWT similar findings were reported. Reasons for these differences were that adolescents and boys were taller, more physically active and presented higher muscle strength than girls and children.31–33 Therefore, it is not surprising that in this study, as in similar studies, sex and age are included in pediatric predictive equations of cardiorespiratory field tests.13,31,34,35 A negative link was also observed between the ISWT and the BMI, i.e., for higher values of BMI, the distance covered in the ISWT was shorter. This may be related to the effort required to perform the walking test due to participant weighing more.36 In fact, a relationship between increased body fat in adolescence and the lower levels of physical activity has been suggested.37
In sum, reference equations are valuable tools for interpreting ISWT results obtained from healthy individuals and patients with chronic diseases, considering the external paced nature of the walk test and the nonexistence of interference from external factors, such as operator encouragement.11 Another motivation for establishing reference equations is the simplicity of predicting the ISWT, requiring only simple and quick measurements obtained in clinical practice. This is of special importance for the pediatric population with which it is often challenging to establish the relatively long periods of collaboration needed to carry out a cardiorespiratory assessment test. Predictive equations, such the one proposed in this study, provide guidance for levels of disability, lead to prescription and individualization of aerobic exercises and levels of physical activity, promote the follow-up of the evolution of children or adolescents in fitness and rehabilitation programs and facilitate comparisons across populations. The importance of producing reference equations that are specific to age and culture is highlighted by the inability of a predictive equation developed in a Brazilian pediatric cohort to accurately estimate ISWT distance performed by Portuguese children and adolescents. In fact, when that equation was applied in our sample, the predicted value was greatly underestimated when compared with the actual ISWT.
Some limitations of this study should be considered. A convenience sample recruited from a single region was used, although care was taken to adjust the number of participants in each age group and the proportion of males and females. Therefore, future research is needed, e.g., this study could be replicated in a larger sample including children from distinct country regions. The average heart rate after the ISWT presented as a percentage of the heart rate maximum predicted was around 60%. This was lower than previous studies in both pediatric and adult populations, which achieved post heart rates of around 90% of the predicted value.12,13 This difference may be related to the timing of the assessment. In our study, the heart rate was not registered immediately after the end of the test. When the test ended, participants were recommended to walk for 1–2min and only after this were the heart rate and blood pressure reassessed. This study used the conventional formula of BMI as an index of obesity in an attempt to simplify the use of the reference equation in clinical practice. Nevertheless, as in children and adolescents BMI is age- and sex-specific, commonly known as BMI-for-age,39 this variable could be explored in future studies. The obtained coefficient of determination was modest (54%), increasing the chance of bias in predicting the walking distance in the ISWT. These limitations confine the generalization of the predictive equation to Portuguese children and adolescents. As an alternative to the multiple linear regression model used in the present study, it might be interesting to compare it with an artificial neural network-based equation model. This model is based on some properties of the biological nervous system and on the analogies of adaptive biological learning,40 using a network combination of the inputs and the learning effect to find the best functional fit for a set of input–output examples.41
ConclusionsThis study established a predictive equation for the ISWT distance, in which age, sex and BMI were major contributors, accounting for 54% of the ISWT variability. This predictive equation is a valuable tool for interpreting ISWT results obtained from pediatric populations, both healthy and with chronic diseases.
FundingCJ has a post-doctoral grant (SFRH/BPD/115169/2016) funded by Fundação para a Ciência e a Tecnologia (FCT), co-financed by the European Social Fund (POCH) and Portuguese national funds from MCTES. The work was also partially funded by Programa Operacional de Competitividade e Internacionalização – COMPETE, through Fundo Europeu de Desenvolvimento Regional – FEDER (POCI-01-0145-FEDER-007628), FCT (PTDC/DTPPIC/2284/2014) and under the project UID/BIM/04501/2013 and UID/BIM/04501/2019.
Conflict of interestThe authors have no conflicts of interest to declare.
The authors would like to acknowledge the participants and the schools enrolled in this study.


