

HRCT is the preferred imaging technique to evaluate Interstitial-Lung-Disease. Optimal Low-Dose-Computed-Tomography protocol for monitoring ILD with lowest radiation dose and optimal diagnostic accuracy and image quality unknown.
Methods28 Patients underwent HRCT. Image reconstructions with varying combinations of tube current (50mA, 20mA, 15 mA, 10mA) and image-thickness/increment (1/1mm, 2/2mm, 3/2.4mm, 5/4mm) were simulated from raw data. 448 CTs evaluated by 2 readers on image quality and ILD-specific features (ground glass opacification (ggo), honeycombing (hc), reticulation (ret)).
ResultsReduced dose settings with 20 mA did not show any significant difference to standard dose settings for all parameters in reader 1, while results were significantly altered in reader 2. Slice thickness did not significantly influence rating of typical ILD features like ggo, hc, ret or total disease extent. The correct differentiation between UIP and NSIP could be made on all dose settings and with all slice thickness. It was even found, that an increased slice thickness can compensate for the noise associated image quality degradation. Overall, for ggo detection a combination of 20 mA and 3 or 5 mm slice thickness was not different to the original evaluation.
ConclusionsAssessment of ILD specific CT features down to 20 mA and a slice thickness of 3 or 5 mm is feasible.
Interstitial lung disease (ILD) encompasses a heterogeneous group of disorders affecting the lung parenchyma that can lead to poor quality of life, hospitalization, and death.1–3 Pulmonary function tests (PFTs) and chest X-rays (CXRs) have insufficient sensitivity to identify early ILD. Thoracic high-resolution computed tomography (HRCT) is the preferred method to detect and differentiate between the different forms of interstitial lung disease, being classified as usual interstitial pneumonia (UIP), probable UIP, indeterminate for UIP and alternative diagnosis (like non-specific interstitial pneumonia (NSIP)).4–6 In lieu of a surgical biopsy, HRCT is an accepted gold standard for the diagnosis of ILD when certain specific findings are present.5–8 Both UIP and NSIP can exhibit reticulation and traction bronchiectasis on chest HRCT; distinguishing radiologic features between these two subsets includes a greater degree of ground glass opacities (GGO) relative to reticulation in NSIP compared to UIP and the presence of honeycombing (HC) in UIP.5,6
HRCT is defined as a slice thickness less than 1.5mm using a high-frequency reconstruction kernel.9 To achieve diagnostic images a certain amount of radiation dose has to be applied to outweigh the image noise. So far, no official recommendations exist regarding latest noise reduction techniques like iterative reconstruction. This may be due to the fact, that each CT vendor uses different algorithms and the inter-study results show varying results of diagnostic accuracy based on the strength of image post-processing.
In light of the malignancy risk associated with exposure to cumulative doses of ionized radiation exposure, there is a trend for clinicians to request lower radiation dose protocols to monitor for ILD progression. These protocols tend to involve helical acquisition of CT data using reduced X-ray exposure parameters.10 This is particularly relevant in patients with ILD who are already at an increased risk of developing pulmonary malignancy.11 Especially repeated, long-term CT chest imaging in adults over 20–30 year periods, has been associated with non-trivial doses of radiation, exceeding that of nuclear plant workers and atomic bomb survivors.12 For imaging of the lung parenchyma – as a high contrast tissue – a high kVp is recommended. Therefore, reduction of radiation dose with CT imaging is achieved by either reducing tube current and/or increasing the image slice interval (i.e. leaving gaps between slices). However, changes in tube current and image slice interval compromise image quality, negatively impact disease detection and estimated disease extent.13,14 Research focused on finding the appropriate balance between CT imaging radiation exposure and optimal image quality is desperately needed. The problem with the design of systematic dose reduction studies is that a repeated CT examination of the same subject is unethical (and would also mean different breath-holds compromising image comparability). Past studies evaluating LDCT imaging in ILD have therefore chosen imaging parameters arbitrarily, failing to establish an optimal LDCT protocol for detecting and distinguishing ILD and its subsets (UIP and NSIP).
As there is no study out evaluating a steady decrease in dose in the same patient, the aim of this study was to find an optimal imaging protocol to identify and grade specific features of ILD in comparison to standard 3d-HRCT.
Materials and methodsPatient and sample populationPatients treated at the Toronto General Hospital-ILD clinic, a tertiary academic referral clinic, were approached for study enrolment between July 2012 and April 2013. Oral and written consent was recorded when the patients were approached while visiting the clinic for regularly scheduled appointments. Patient consent records were stored securely with their study records. Adult patients (≥18 years of age) with a diagnosis of IPF, idiopathic NSIP, or connective tissue disease (CTD)-ILD and who required a thoracic CT at their visit were included. Patients with a history of pneumotoxic medication use, environmental exposures, granulomatous lung disease (i.e. sarcoidosis) or other idiopathic interstitial pneumonias were excluded from this study. A diagnosis of IPF was based on criteria outlined by American Thoracic Society guidelines.5,6 A rheumatologist evaluated all patients to confirm the presence of a CTD (rheumatoid arthritis, systemic sclerosis, idiopathic inflammatory myositis, Sjogren's syndrome, mixed connective tissue disease, systemic lupus erythematosus, or undifferentiated connective tissue disease).
Ethics approval was obtained prior to patient enrolment from both the BLINDED FOR REVIEW Research Ethics Board and the BLINDED FOR REVIEW Research Ethics Board.
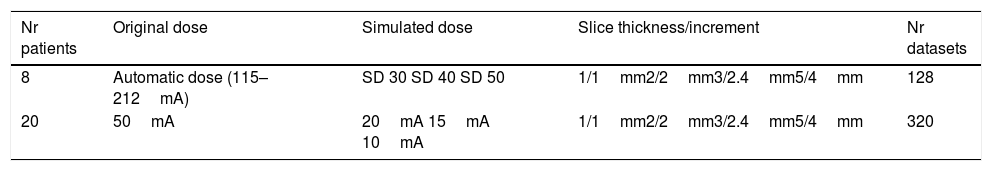
CT image acquisition and assessmentPatients were scanned in the prone position during full inspiration. Average patient anterior–posterior (AP) and left–right (LR) body size was 253.8mm (S.E.=8.3) and 328.3mm (S.E.=6.7) respectively. Images were acquired with a 64mm×0.5mm detector configuration using two CT scanners: Aquilion 64 (n=26) or Aquilion One (n=5) (both Toshiba Medical Systems, Ottawara, Japan). Image acquisition was done with the clinical routine protocol (120kVp, 0.5s rotation time). The raw data from each clinical scan was stored and used for low dose simulation using the Toshiba low dose simulation software.15 No iterative reconstruction techniques were used. Some original data were acquired using automatic dose exposure (n=8, 115–212mA – depending on body habitus), and others with fixed mA settings (50mA). For low dose simulation, the noise levels were reconstructed for the following standard deviation (SD) of noise of 30, 40 and 50 Hounsfield Units (HU) (as allowed by the software). The fixed mA datasets were simulated at 20mA, 15mA and 10mA. Reconstruction was done with various slice thicknesses/increments: 1mm/1mm, 2mm/2mm, 3mm/2.4mm, and 5mm/4mm (for the thicker slice thicknesses an overlap of 20% was chosen to allow for increased characterization benefit16). The reconstruction kernel was FC03 (soft tissue kernel) to reduce noise without limiting imaging characteristics known from CAD. This setting allowed for intra-individual comparison of the impact of dose reduction. As the same raw data set was used, there were no variations in physiological conditions, such as inspiratory depth and fluid content. Only one CT scan was performed on each study participant, thus no additional radiation burden was applied.
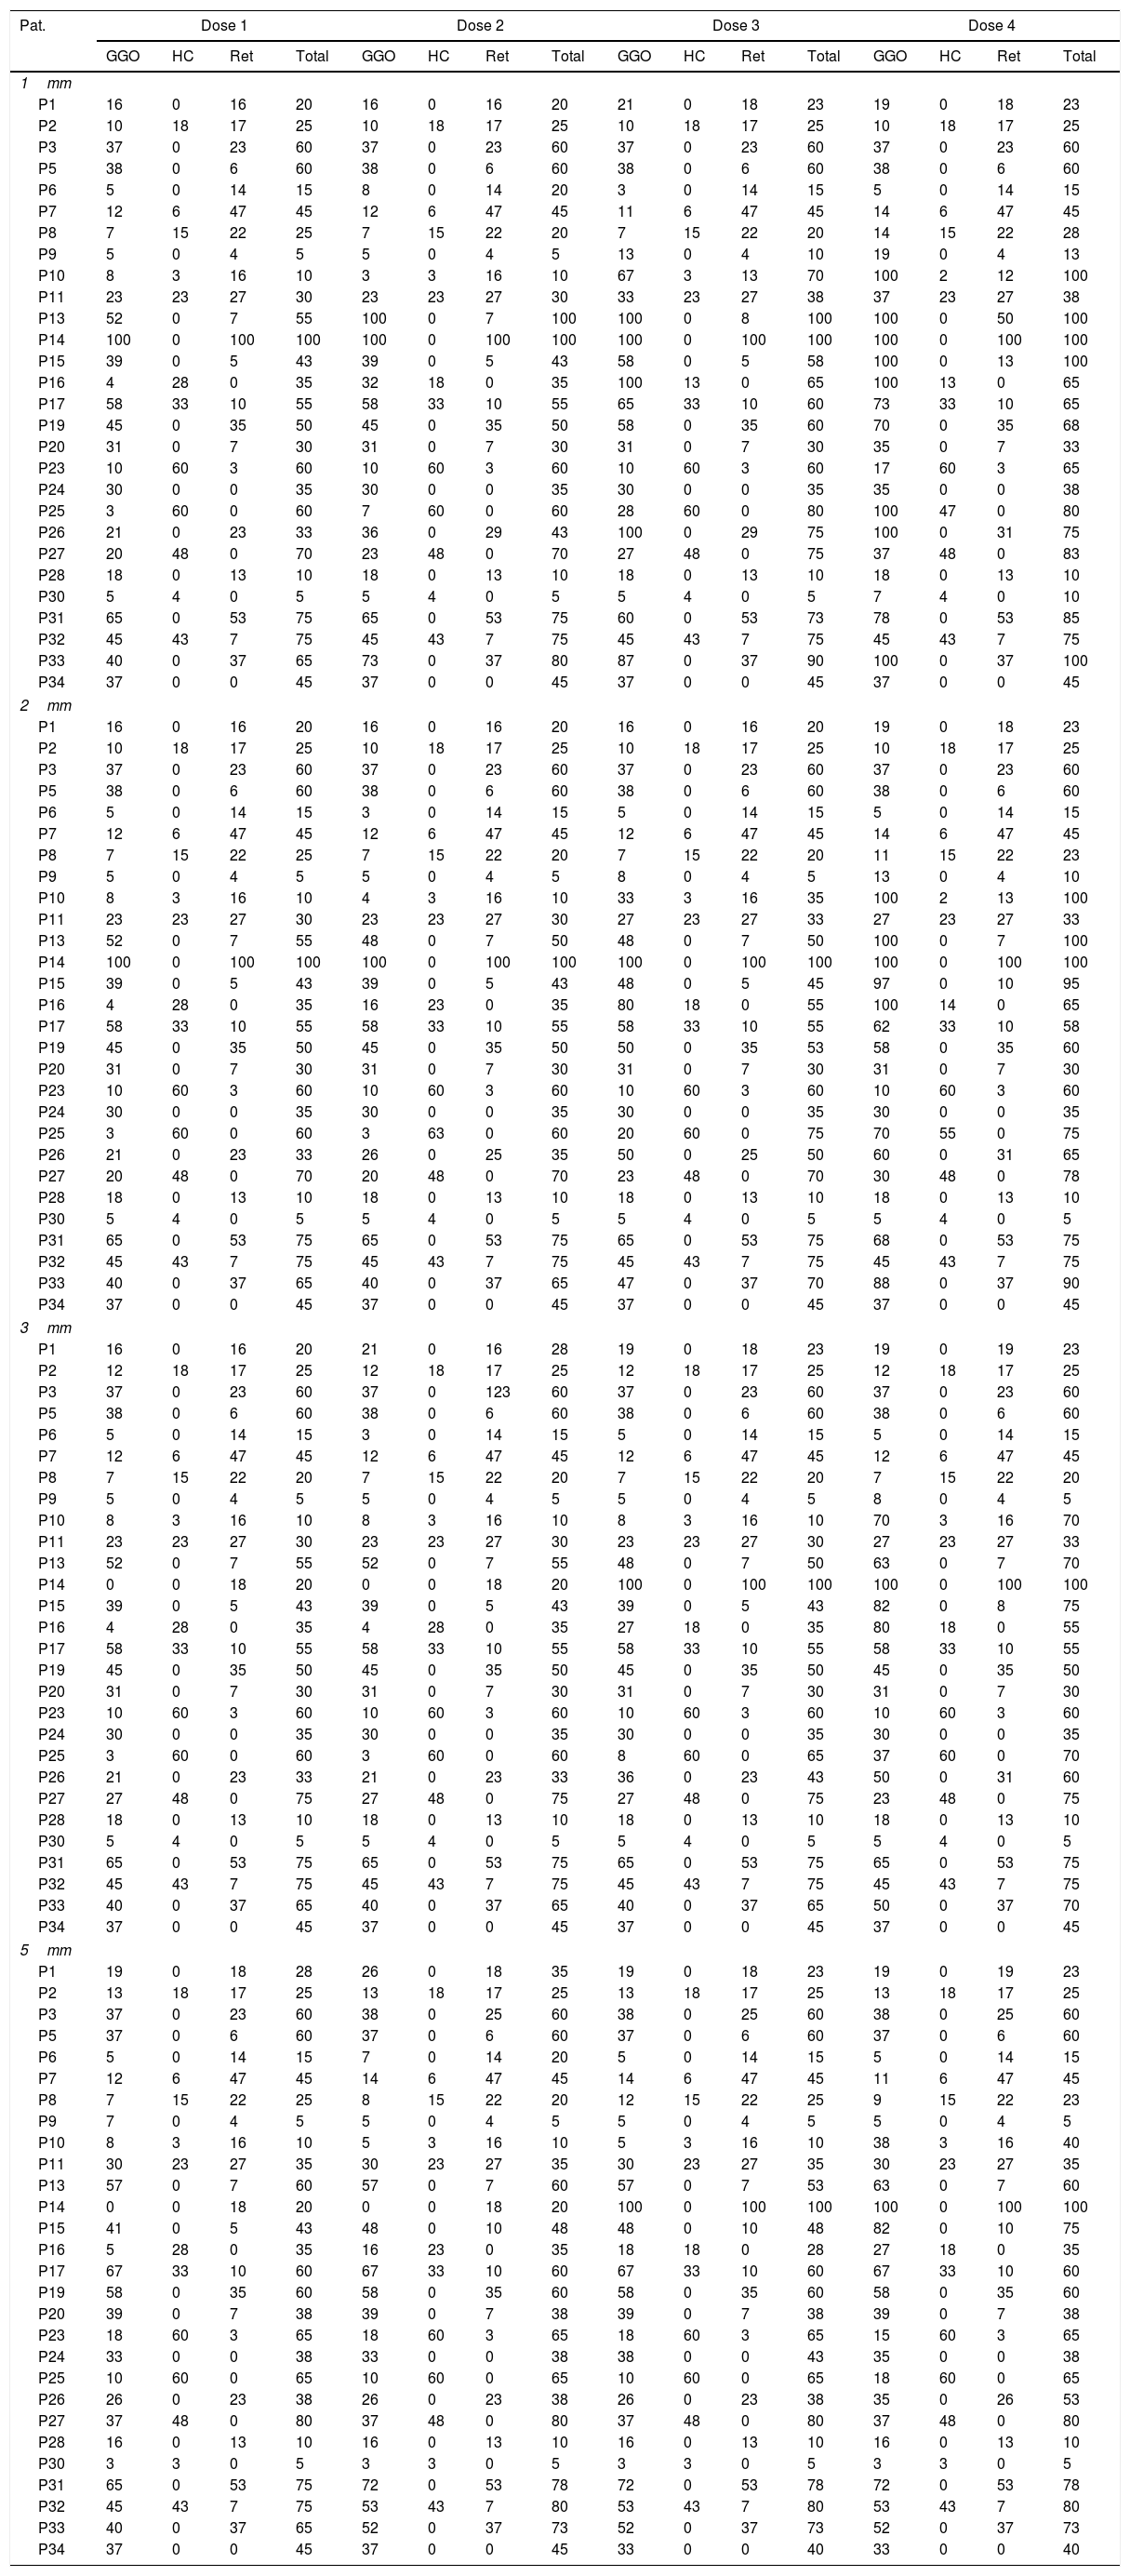
Overall, 28 patients with 4 different dose settings and 4 slice thickness/increment settings were reconstructed, in total 448 CT datasets were used for evaluation (Table 1).
The clinical dose CT dataset (original dose, no noise) with 1mm slice thickness was used as reference standard.
All CT images were interpreted in random order and separately by a radiologist (reader 1) with over 15 years of experience in thoracic radiology, and one second year radiology resident (reader 2). Both were blinded to the patients’ clinical history. Lung parenchyma was evaluated by individual lobe (right upper, right middle, right lower, left upper, lingua and left lower) for the presence of GGO, reticulation, and HC. Each lobe was scored for extent of these changes from 0 to 100% in 5% intervals. GGO was defined according to the Fleischner Glossary of Terms for Thoracic Imaging as an increase in lung attenuation without obscuring pulmonary vessels, reticulation as fine or thick reticular grid and thickened interlobular septa and honeycombing as peripheral cysts within a coarse reticulation.17
An overall estimate of image quality, number of lobes involved and total percent of diseased lung was provided by the readers for each patient's series. Image quality was rated on a scale from 1 to 4, with 1 indicating excellent image quality without any artefacts; 2 indicating good image quality with minor streak artefacts without limiting image interpretation; 3 indicating moderate image quality with more severe streak artefacts limiting image interpretation; and 4 indicating bad image quality with severe artefacts significantly impairing image interpretation. The radiologic pattern was recorded as UIP, NSIP, or non-classifiable fibrosis for all CT scans at each LDCT series. UIP and NSIP were defined in accordance with ATS guidelines for IPF and the idiopathic interstitial pneumonias (IIPs) respectively.5,6 As mentioned above, HRCT scans with the highest tube current (clinical established dose levels), 1mm slice thickness were established as the conventional (reference) standard.
The optimal LDCT was selected based on the following three features:(1) diagnostic accuracy, (2) image quality and (3) delivered radiation dose between series. Diagnostic accuracy was considered the most important operating characteristic, given that the overall radiographic pattern often influences clinical diagnosis and treatment decisions. Image quality influences the perception of other CT imaging features (i.e. GGO, reticulation and disease) and hence was chosen as the second most important factor. LDCT imaging series’ with similar diagnostic accuracy and image quality were differentiated based on delivered radiation dose, with the lowest dose series deemed most optimal.
Statistical analysisFor statistical analysis the average scores for total involvement of GGO, reticulation and HC across all lobes were enumerated. Also, the total disease extent was used (average of the sum of all three types of radiographic changes between the left and right lungs). Mixed linear models were used to investigate the effects of different series on operating characteristics and imaging features. The estimation method “REML” (residual (restricted) maximum likelihood) was used.
Statistical evaluation was done on a per-patient basis using SAS Version 9.3, Cary, North Carolina, USA. A local level of significance (p) of <0.05 was considered statistically significantly.
ResultsPatient population and baseline HRCT imagingOf 35 patients approached for study involvement, seven were excluded (4 due to difficulty attaining stored CT images, 2 with hypersensitivity pneumonitis, and 1 with sarcoidosis). Among 28 patients evaluated (56% female) with approximately one-third having a past history of cigarette smoking (Table 2). A clinical diagnosis of IPF and NSIP were made in 20%, and 80% patients respectively. Routine clinical HRCT imaging (120kV, fixed 50mA or dose modulation 115–212mA, 1mm slice thickness) (Table 1), was reported as UIP in 6 cases (24%) and NSIP in 19 (76%) cases. In total, 448 individual CT scans were generated, reviewed and analyzed.
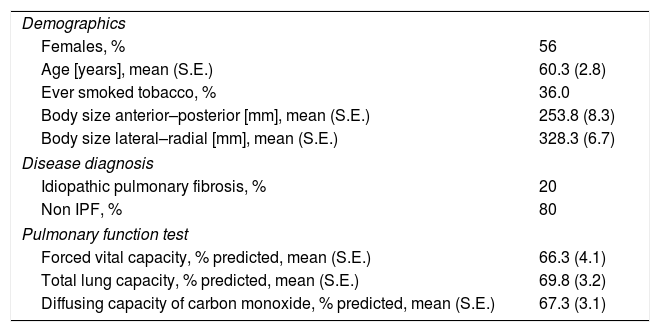
Demographic, disease, and pulmonary characteristics of 28 patients with ILD.
| Demographics | |
| Females, % | 56 |
| Age [years], mean (S.E.) | 60.3 (2.8) |
| Ever smoked tobacco, % | 36.0 |
| Body size anterior–posterior [mm], mean (S.E.) | 253.8 (8.3) |
| Body size lateral–radial [mm], mean (S.E.) | 328.3 (6.7) |
| Disease diagnosis | |
| Idiopathic pulmonary fibrosis, % | 20 |
| Non IPF, % | 80 |
| Pulmonary function test | |
| Forced vital capacity, % predicted, mean (S.E.) | 66.3 (4.1) |
| Total lung capacity, % predicted, mean (S.E.) | 69.8 (3.2) |
| Diffusing capacity of carbon monoxide, % predicted, mean (S.E.) | 67.3 (3.1) |
To provide the utmost insight into the data, the evaluation results of reader 1 are provided in Table 3. Given the huge amount of primary data, “Results” section is focused on the statistical results. As mentioned above, for each radiological feature the percentage of affected/diseased lung was visually assessed for each dose level and slice thickness.
Individual results of reader 1 for the different dose levels (doses 1–4) and parameters: ground glass opacification (GGO), honeycombing (HC), reticulations (Ret) and total amount of disease (total).
| Pat. | Dose 1 | Dose 2 | Dose 3 | Dose 4 | ||||||||||||
|---|---|---|---|---|---|---|---|---|---|---|---|---|---|---|---|---|
| GGO | HC | Ret | Total | GGO | HC | Ret | Total | GGO | HC | Ret | Total | GGO | HC | Ret | Total | |
| 1mm | ||||||||||||||||
| P1 | 16 | 0 | 16 | 20 | 16 | 0 | 16 | 20 | 21 | 0 | 18 | 23 | 19 | 0 | 18 | 23 |
| P2 | 10 | 18 | 17 | 25 | 10 | 18 | 17 | 25 | 10 | 18 | 17 | 25 | 10 | 18 | 17 | 25 |
| P3 | 37 | 0 | 23 | 60 | 37 | 0 | 23 | 60 | 37 | 0 | 23 | 60 | 37 | 0 | 23 | 60 |
| P5 | 38 | 0 | 6 | 60 | 38 | 0 | 6 | 60 | 38 | 0 | 6 | 60 | 38 | 0 | 6 | 60 |
| P6 | 5 | 0 | 14 | 15 | 8 | 0 | 14 | 20 | 3 | 0 | 14 | 15 | 5 | 0 | 14 | 15 |
| P7 | 12 | 6 | 47 | 45 | 12 | 6 | 47 | 45 | 11 | 6 | 47 | 45 | 14 | 6 | 47 | 45 |
| P8 | 7 | 15 | 22 | 25 | 7 | 15 | 22 | 20 | 7 | 15 | 22 | 20 | 14 | 15 | 22 | 28 |
| P9 | 5 | 0 | 4 | 5 | 5 | 0 | 4 | 5 | 13 | 0 | 4 | 10 | 19 | 0 | 4 | 13 |
| P10 | 8 | 3 | 16 | 10 | 3 | 3 | 16 | 10 | 67 | 3 | 13 | 70 | 100 | 2 | 12 | 100 |
| P11 | 23 | 23 | 27 | 30 | 23 | 23 | 27 | 30 | 33 | 23 | 27 | 38 | 37 | 23 | 27 | 38 |
| P13 | 52 | 0 | 7 | 55 | 100 | 0 | 7 | 100 | 100 | 0 | 8 | 100 | 100 | 0 | 50 | 100 |
| P14 | 100 | 0 | 100 | 100 | 100 | 0 | 100 | 100 | 100 | 0 | 100 | 100 | 100 | 0 | 100 | 100 |
| P15 | 39 | 0 | 5 | 43 | 39 | 0 | 5 | 43 | 58 | 0 | 5 | 58 | 100 | 0 | 13 | 100 |
| P16 | 4 | 28 | 0 | 35 | 32 | 18 | 0 | 35 | 100 | 13 | 0 | 65 | 100 | 13 | 0 | 65 |
| P17 | 58 | 33 | 10 | 55 | 58 | 33 | 10 | 55 | 65 | 33 | 10 | 60 | 73 | 33 | 10 | 65 |
| P19 | 45 | 0 | 35 | 50 | 45 | 0 | 35 | 50 | 58 | 0 | 35 | 60 | 70 | 0 | 35 | 68 |
| P20 | 31 | 0 | 7 | 30 | 31 | 0 | 7 | 30 | 31 | 0 | 7 | 30 | 35 | 0 | 7 | 33 |
| P23 | 10 | 60 | 3 | 60 | 10 | 60 | 3 | 60 | 10 | 60 | 3 | 60 | 17 | 60 | 3 | 65 |
| P24 | 30 | 0 | 0 | 35 | 30 | 0 | 0 | 35 | 30 | 0 | 0 | 35 | 35 | 0 | 0 | 38 |
| P25 | 3 | 60 | 0 | 60 | 7 | 60 | 0 | 60 | 28 | 60 | 0 | 80 | 100 | 47 | 0 | 80 |
| P26 | 21 | 0 | 23 | 33 | 36 | 0 | 29 | 43 | 100 | 0 | 29 | 75 | 100 | 0 | 31 | 75 |
| P27 | 20 | 48 | 0 | 70 | 23 | 48 | 0 | 70 | 27 | 48 | 0 | 75 | 37 | 48 | 0 | 83 |
| P28 | 18 | 0 | 13 | 10 | 18 | 0 | 13 | 10 | 18 | 0 | 13 | 10 | 18 | 0 | 13 | 10 |
| P30 | 5 | 4 | 0 | 5 | 5 | 4 | 0 | 5 | 5 | 4 | 0 | 5 | 7 | 4 | 0 | 10 |
| P31 | 65 | 0 | 53 | 75 | 65 | 0 | 53 | 75 | 60 | 0 | 53 | 73 | 78 | 0 | 53 | 85 |
| P32 | 45 | 43 | 7 | 75 | 45 | 43 | 7 | 75 | 45 | 43 | 7 | 75 | 45 | 43 | 7 | 75 |
| P33 | 40 | 0 | 37 | 65 | 73 | 0 | 37 | 80 | 87 | 0 | 37 | 90 | 100 | 0 | 37 | 100 |
| P34 | 37 | 0 | 0 | 45 | 37 | 0 | 0 | 45 | 37 | 0 | 0 | 45 | 37 | 0 | 0 | 45 |
| 2mm | ||||||||||||||||
| P1 | 16 | 0 | 16 | 20 | 16 | 0 | 16 | 20 | 16 | 0 | 16 | 20 | 19 | 0 | 18 | 23 |
| P2 | 10 | 18 | 17 | 25 | 10 | 18 | 17 | 25 | 10 | 18 | 17 | 25 | 10 | 18 | 17 | 25 |
| P3 | 37 | 0 | 23 | 60 | 37 | 0 | 23 | 60 | 37 | 0 | 23 | 60 | 37 | 0 | 23 | 60 |
| P5 | 38 | 0 | 6 | 60 | 38 | 0 | 6 | 60 | 38 | 0 | 6 | 60 | 38 | 0 | 6 | 60 |
| P6 | 5 | 0 | 14 | 15 | 3 | 0 | 14 | 15 | 5 | 0 | 14 | 15 | 5 | 0 | 14 | 15 |
| P7 | 12 | 6 | 47 | 45 | 12 | 6 | 47 | 45 | 12 | 6 | 47 | 45 | 14 | 6 | 47 | 45 |
| P8 | 7 | 15 | 22 | 25 | 7 | 15 | 22 | 20 | 7 | 15 | 22 | 20 | 11 | 15 | 22 | 23 |
| P9 | 5 | 0 | 4 | 5 | 5 | 0 | 4 | 5 | 8 | 0 | 4 | 5 | 13 | 0 | 4 | 10 |
| P10 | 8 | 3 | 16 | 10 | 4 | 3 | 16 | 10 | 33 | 3 | 16 | 35 | 100 | 2 | 13 | 100 |
| P11 | 23 | 23 | 27 | 30 | 23 | 23 | 27 | 30 | 27 | 23 | 27 | 33 | 27 | 23 | 27 | 33 |
| P13 | 52 | 0 | 7 | 55 | 48 | 0 | 7 | 50 | 48 | 0 | 7 | 50 | 100 | 0 | 7 | 100 |
| P14 | 100 | 0 | 100 | 100 | 100 | 0 | 100 | 100 | 100 | 0 | 100 | 100 | 100 | 0 | 100 | 100 |
| P15 | 39 | 0 | 5 | 43 | 39 | 0 | 5 | 43 | 48 | 0 | 5 | 45 | 97 | 0 | 10 | 95 |
| P16 | 4 | 28 | 0 | 35 | 16 | 23 | 0 | 35 | 80 | 18 | 0 | 55 | 100 | 14 | 0 | 65 |
| P17 | 58 | 33 | 10 | 55 | 58 | 33 | 10 | 55 | 58 | 33 | 10 | 55 | 62 | 33 | 10 | 58 |
| P19 | 45 | 0 | 35 | 50 | 45 | 0 | 35 | 50 | 50 | 0 | 35 | 53 | 58 | 0 | 35 | 60 |
| P20 | 31 | 0 | 7 | 30 | 31 | 0 | 7 | 30 | 31 | 0 | 7 | 30 | 31 | 0 | 7 | 30 |
| P23 | 10 | 60 | 3 | 60 | 10 | 60 | 3 | 60 | 10 | 60 | 3 | 60 | 10 | 60 | 3 | 60 |
| P24 | 30 | 0 | 0 | 35 | 30 | 0 | 0 | 35 | 30 | 0 | 0 | 35 | 30 | 0 | 0 | 35 |
| P25 | 3 | 60 | 0 | 60 | 3 | 63 | 0 | 60 | 20 | 60 | 0 | 75 | 70 | 55 | 0 | 75 |
| P26 | 21 | 0 | 23 | 33 | 26 | 0 | 25 | 35 | 50 | 0 | 25 | 50 | 60 | 0 | 31 | 65 |
| P27 | 20 | 48 | 0 | 70 | 20 | 48 | 0 | 70 | 23 | 48 | 0 | 70 | 30 | 48 | 0 | 78 |
| P28 | 18 | 0 | 13 | 10 | 18 | 0 | 13 | 10 | 18 | 0 | 13 | 10 | 18 | 0 | 13 | 10 |
| P30 | 5 | 4 | 0 | 5 | 5 | 4 | 0 | 5 | 5 | 4 | 0 | 5 | 5 | 4 | 0 | 5 |
| P31 | 65 | 0 | 53 | 75 | 65 | 0 | 53 | 75 | 65 | 0 | 53 | 75 | 68 | 0 | 53 | 75 |
| P32 | 45 | 43 | 7 | 75 | 45 | 43 | 7 | 75 | 45 | 43 | 7 | 75 | 45 | 43 | 7 | 75 |
| P33 | 40 | 0 | 37 | 65 | 40 | 0 | 37 | 65 | 47 | 0 | 37 | 70 | 88 | 0 | 37 | 90 |
| P34 | 37 | 0 | 0 | 45 | 37 | 0 | 0 | 45 | 37 | 0 | 0 | 45 | 37 | 0 | 0 | 45 |
| 3mm | ||||||||||||||||
| P1 | 16 | 0 | 16 | 20 | 21 | 0 | 16 | 28 | 19 | 0 | 18 | 23 | 19 | 0 | 19 | 23 |
| P2 | 12 | 18 | 17 | 25 | 12 | 18 | 17 | 25 | 12 | 18 | 17 | 25 | 12 | 18 | 17 | 25 |
| P3 | 37 | 0 | 23 | 60 | 37 | 0 | 123 | 60 | 37 | 0 | 23 | 60 | 37 | 0 | 23 | 60 |
| P5 | 38 | 0 | 6 | 60 | 38 | 0 | 6 | 60 | 38 | 0 | 6 | 60 | 38 | 0 | 6 | 60 |
| P6 | 5 | 0 | 14 | 15 | 3 | 0 | 14 | 15 | 5 | 0 | 14 | 15 | 5 | 0 | 14 | 15 |
| P7 | 12 | 6 | 47 | 45 | 12 | 6 | 47 | 45 | 12 | 6 | 47 | 45 | 12 | 6 | 47 | 45 |
| P8 | 7 | 15 | 22 | 20 | 7 | 15 | 22 | 20 | 7 | 15 | 22 | 20 | 7 | 15 | 22 | 20 |
| P9 | 5 | 0 | 4 | 5 | 5 | 0 | 4 | 5 | 5 | 0 | 4 | 5 | 8 | 0 | 4 | 5 |
| P10 | 8 | 3 | 16 | 10 | 8 | 3 | 16 | 10 | 8 | 3 | 16 | 10 | 70 | 3 | 16 | 70 |
| P11 | 23 | 23 | 27 | 30 | 23 | 23 | 27 | 30 | 23 | 23 | 27 | 30 | 27 | 23 | 27 | 33 |
| P13 | 52 | 0 | 7 | 55 | 52 | 0 | 7 | 55 | 48 | 0 | 7 | 50 | 63 | 0 | 7 | 70 |
| P14 | 0 | 0 | 18 | 20 | 0 | 0 | 18 | 20 | 100 | 0 | 100 | 100 | 100 | 0 | 100 | 100 |
| P15 | 39 | 0 | 5 | 43 | 39 | 0 | 5 | 43 | 39 | 0 | 5 | 43 | 82 | 0 | 8 | 75 |
| P16 | 4 | 28 | 0 | 35 | 4 | 28 | 0 | 35 | 27 | 18 | 0 | 35 | 80 | 18 | 0 | 55 |
| P17 | 58 | 33 | 10 | 55 | 58 | 33 | 10 | 55 | 58 | 33 | 10 | 55 | 58 | 33 | 10 | 55 |
| P19 | 45 | 0 | 35 | 50 | 45 | 0 | 35 | 50 | 45 | 0 | 35 | 50 | 45 | 0 | 35 | 50 |
| P20 | 31 | 0 | 7 | 30 | 31 | 0 | 7 | 30 | 31 | 0 | 7 | 30 | 31 | 0 | 7 | 30 |
| P23 | 10 | 60 | 3 | 60 | 10 | 60 | 3 | 60 | 10 | 60 | 3 | 60 | 10 | 60 | 3 | 60 |
| P24 | 30 | 0 | 0 | 35 | 30 | 0 | 0 | 35 | 30 | 0 | 0 | 35 | 30 | 0 | 0 | 35 |
| P25 | 3 | 60 | 0 | 60 | 3 | 60 | 0 | 60 | 8 | 60 | 0 | 65 | 37 | 60 | 0 | 70 |
| P26 | 21 | 0 | 23 | 33 | 21 | 0 | 23 | 33 | 36 | 0 | 23 | 43 | 50 | 0 | 31 | 60 |
| P27 | 27 | 48 | 0 | 75 | 27 | 48 | 0 | 75 | 27 | 48 | 0 | 75 | 23 | 48 | 0 | 75 |
| P28 | 18 | 0 | 13 | 10 | 18 | 0 | 13 | 10 | 18 | 0 | 13 | 10 | 18 | 0 | 13 | 10 |
| P30 | 5 | 4 | 0 | 5 | 5 | 4 | 0 | 5 | 5 | 4 | 0 | 5 | 5 | 4 | 0 | 5 |
| P31 | 65 | 0 | 53 | 75 | 65 | 0 | 53 | 75 | 65 | 0 | 53 | 75 | 65 | 0 | 53 | 75 |
| P32 | 45 | 43 | 7 | 75 | 45 | 43 | 7 | 75 | 45 | 43 | 7 | 75 | 45 | 43 | 7 | 75 |
| P33 | 40 | 0 | 37 | 65 | 40 | 0 | 37 | 65 | 40 | 0 | 37 | 65 | 50 | 0 | 37 | 70 |
| P34 | 37 | 0 | 0 | 45 | 37 | 0 | 0 | 45 | 37 | 0 | 0 | 45 | 37 | 0 | 0 | 45 |
| 5mm | ||||||||||||||||
| P1 | 19 | 0 | 18 | 28 | 26 | 0 | 18 | 35 | 19 | 0 | 18 | 23 | 19 | 0 | 19 | 23 |
| P2 | 13 | 18 | 17 | 25 | 13 | 18 | 17 | 25 | 13 | 18 | 17 | 25 | 13 | 18 | 17 | 25 |
| P3 | 37 | 0 | 23 | 60 | 38 | 0 | 25 | 60 | 38 | 0 | 25 | 60 | 38 | 0 | 25 | 60 |
| P5 | 37 | 0 | 6 | 60 | 37 | 0 | 6 | 60 | 37 | 0 | 6 | 60 | 37 | 0 | 6 | 60 |
| P6 | 5 | 0 | 14 | 15 | 7 | 0 | 14 | 20 | 5 | 0 | 14 | 15 | 5 | 0 | 14 | 15 |
| P7 | 12 | 6 | 47 | 45 | 14 | 6 | 47 | 45 | 14 | 6 | 47 | 45 | 11 | 6 | 47 | 45 |
| P8 | 7 | 15 | 22 | 25 | 8 | 15 | 22 | 20 | 12 | 15 | 22 | 25 | 9 | 15 | 22 | 23 |
| P9 | 7 | 0 | 4 | 5 | 5 | 0 | 4 | 5 | 5 | 0 | 4 | 5 | 5 | 0 | 4 | 5 |
| P10 | 8 | 3 | 16 | 10 | 5 | 3 | 16 | 10 | 5 | 3 | 16 | 10 | 38 | 3 | 16 | 40 |
| P11 | 30 | 23 | 27 | 35 | 30 | 23 | 27 | 35 | 30 | 23 | 27 | 35 | 30 | 23 | 27 | 35 |
| P13 | 57 | 0 | 7 | 60 | 57 | 0 | 7 | 60 | 57 | 0 | 7 | 53 | 63 | 0 | 7 | 60 |
| P14 | 0 | 0 | 18 | 20 | 0 | 0 | 18 | 20 | 100 | 0 | 100 | 100 | 100 | 0 | 100 | 100 |
| P15 | 41 | 0 | 5 | 43 | 48 | 0 | 10 | 48 | 48 | 0 | 10 | 48 | 82 | 0 | 10 | 75 |
| P16 | 5 | 28 | 0 | 35 | 16 | 23 | 0 | 35 | 18 | 18 | 0 | 28 | 27 | 18 | 0 | 35 |
| P17 | 67 | 33 | 10 | 60 | 67 | 33 | 10 | 60 | 67 | 33 | 10 | 60 | 67 | 33 | 10 | 60 |
| P19 | 58 | 0 | 35 | 60 | 58 | 0 | 35 | 60 | 58 | 0 | 35 | 60 | 58 | 0 | 35 | 60 |
| P20 | 39 | 0 | 7 | 38 | 39 | 0 | 7 | 38 | 39 | 0 | 7 | 38 | 39 | 0 | 7 | 38 |
| P23 | 18 | 60 | 3 | 65 | 18 | 60 | 3 | 65 | 18 | 60 | 3 | 65 | 15 | 60 | 3 | 65 |
| P24 | 33 | 0 | 0 | 38 | 33 | 0 | 0 | 38 | 38 | 0 | 0 | 43 | 35 | 0 | 0 | 38 |
| P25 | 10 | 60 | 0 | 65 | 10 | 60 | 0 | 65 | 10 | 60 | 0 | 65 | 18 | 60 | 0 | 65 |
| P26 | 26 | 0 | 23 | 38 | 26 | 0 | 23 | 38 | 26 | 0 | 23 | 38 | 35 | 0 | 26 | 53 |
| P27 | 37 | 48 | 0 | 80 | 37 | 48 | 0 | 80 | 37 | 48 | 0 | 80 | 37 | 48 | 0 | 80 |
| P28 | 16 | 0 | 13 | 10 | 16 | 0 | 13 | 10 | 16 | 0 | 13 | 10 | 16 | 0 | 13 | 10 |
| P30 | 3 | 3 | 0 | 5 | 3 | 3 | 0 | 5 | 3 | 3 | 0 | 5 | 3 | 3 | 0 | 5 |
| P31 | 65 | 0 | 53 | 75 | 72 | 0 | 53 | 78 | 72 | 0 | 53 | 78 | 72 | 0 | 53 | 78 |
| P32 | 45 | 43 | 7 | 75 | 53 | 43 | 7 | 80 | 53 | 43 | 7 | 80 | 53 | 43 | 7 | 80 |
| P33 | 40 | 0 | 37 | 65 | 52 | 0 | 37 | 73 | 52 | 0 | 37 | 73 | 52 | 0 | 37 | 73 |
| P34 | 37 | 0 | 0 | 45 | 37 | 0 | 0 | 45 | 33 | 0 | 0 | 40 | 33 | 0 | 0 | 40 |
For 1mm slice thickness (increment 1mm).
For 2mm slice thickness (increment 2mm).
For 3mm slice thickness (increment 2.4mm).
For 5mm slice thickness (increment 4mm).
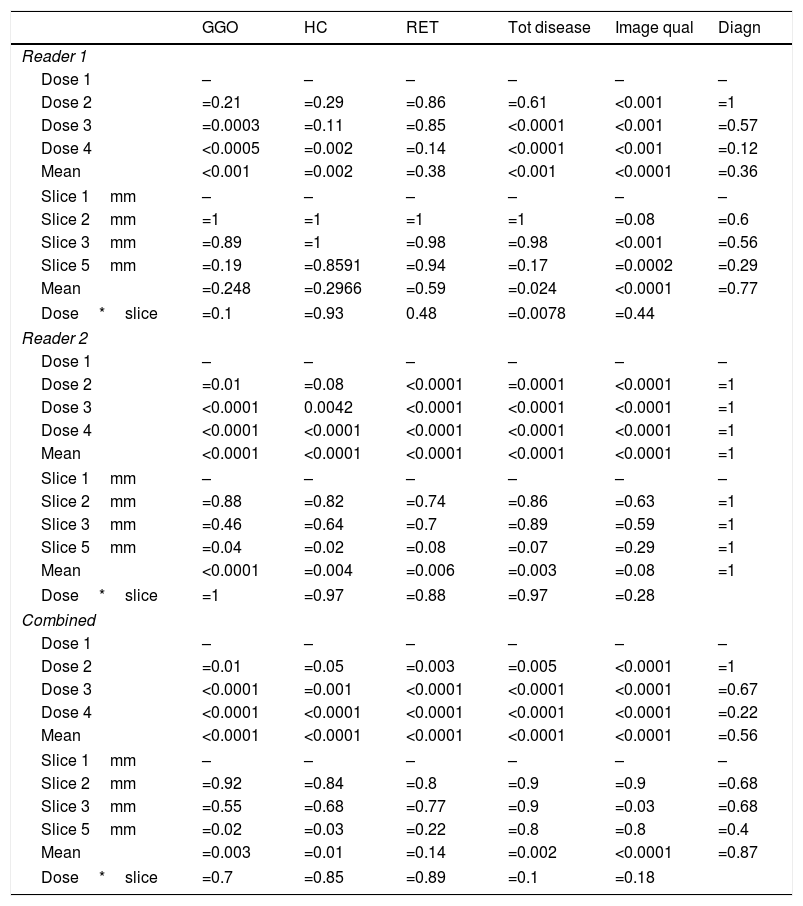
The overall analysis found a significant (p<0.001) influence of dose on the correct findings for GGOs (Fig. 1). In detail, for reader 1, the second dose level was not significantly different from the reference standard (p=0.21), while dose level three and four showed significant differences (p=0.0003 and p<0.0005, respectively) (Table 4). For reader 2, even the second dose level led to a significant difference in evaluation of the amount of ggo pattern.
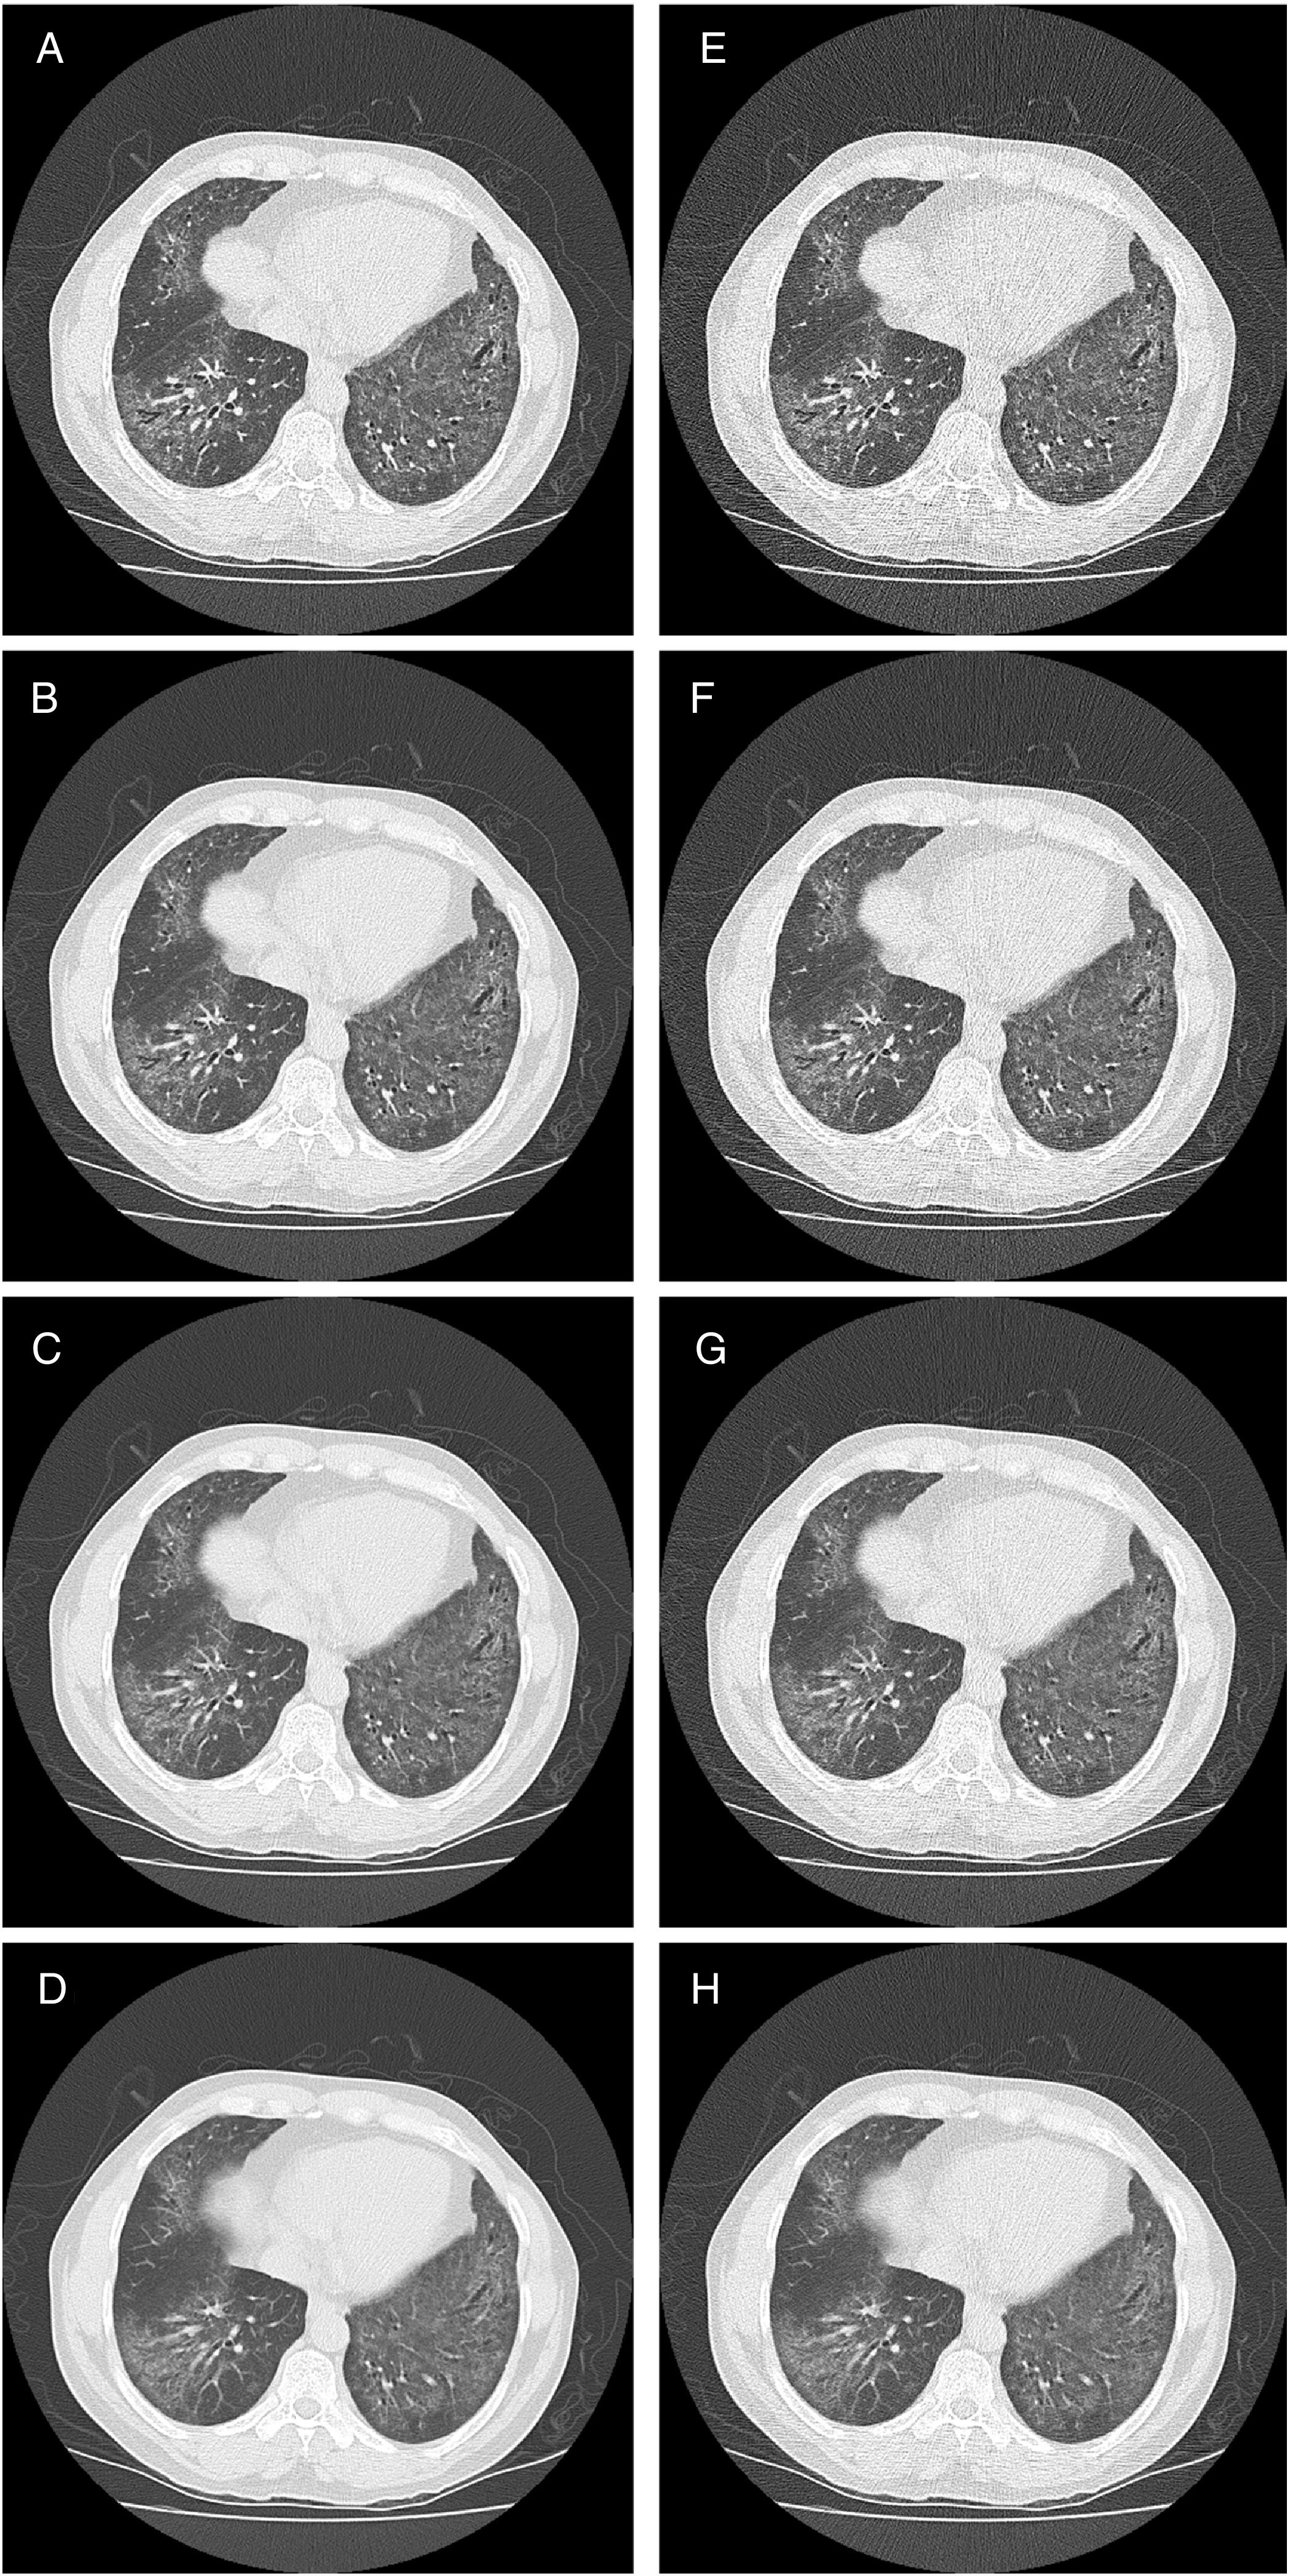
; images are displayed with W/L: 1600/−600HU. 1mm slice thickness (A and E), 2mm slice thickness (B and F), 3mm slice thickness (C and G) and 5mm slice thickness (D and H).")
Statistical results for reader 1, reader 2, and combined of original and simulated CT datasets with respect to typical ILD features like ground glass opacities (GGO), honeycombing (HC), and reticulation (RET). Mean values were calculated using the SAS procedure “GLIMMIX”. Also, total disease extend, image quality and diagnostic accuracy are shown.
| GGO | HC | RET | Tot disease | Image qual | Diagn | |
|---|---|---|---|---|---|---|
| Reader 1 | ||||||
| Dose 1 | – | – | – | – | – | – |
| Dose 2 | =0.21 | =0.29 | =0.86 | =0.61 | <0.001 | =1 |
| Dose 3 | =0.0003 | =0.11 | =0.85 | <0.0001 | <0.001 | =0.57 |
| Dose 4 | <0.0005 | =0.002 | =0.14 | <0.0001 | <0.001 | =0.12 |
| Mean | <0.001 | =0.002 | =0.38 | <0.001 | <0.0001 | =0.36 |
| Slice 1mm | – | – | – | – | – | – |
| Slice 2mm | =1 | =1 | =1 | =1 | =0.08 | =0.6 |
| Slice 3mm | =0.89 | =1 | =0.98 | =0.98 | <0.001 | =0.56 |
| Slice 5mm | =0.19 | =0.8591 | =0.94 | =0.17 | =0.0002 | =0.29 |
| Mean | =0.248 | =0.2966 | =0.59 | =0.024 | <0.0001 | =0.77 |
| Dose*slice | =0.1 | =0.93 | 0.48 | =0.0078 | =0.44 | |
| Reader 2 | ||||||
| Dose 1 | – | – | – | – | – | – |
| Dose 2 | =0.01 | =0.08 | <0.0001 | =0.0001 | <0.0001 | =1 |
| Dose 3 | <0.0001 | 0.0042 | <0.0001 | <0.0001 | <0.0001 | =1 |
| Dose 4 | <0.0001 | <0.0001 | <0.0001 | <0.0001 | <0.0001 | =1 |
| Mean | <0.0001 | <0.0001 | <0.0001 | <0.0001 | <0.0001 | =1 |
| Slice 1mm | – | – | – | – | – | – |
| Slice 2mm | =0.88 | =0.82 | =0.74 | =0.86 | =0.63 | =1 |
| Slice 3mm | =0.46 | =0.64 | =0.7 | =0.89 | =0.59 | =1 |
| Slice 5mm | =0.04 | =0.02 | =0.08 | =0.07 | =0.29 | =1 |
| Mean | <0.0001 | =0.004 | =0.006 | =0.003 | =0.08 | =1 |
| Dose*slice | =1 | =0.97 | =0.88 | =0.97 | =0.28 | |
| Combined | ||||||
| Dose 1 | – | – | – | – | – | – |
| Dose 2 | =0.01 | =0.05 | =0.003 | =0.005 | <0.0001 | =1 |
| Dose 3 | <0.0001 | =0.001 | <0.0001 | <0.0001 | <0.0001 | =0.67 |
| Dose 4 | <0.0001 | <0.0001 | <0.0001 | <0.0001 | <0.0001 | =0.22 |
| Mean | <0.0001 | <0.0001 | <0.0001 | <0.0001 | <0.0001 | =0.56 |
| Slice 1mm | – | – | – | – | – | – |
| Slice 2mm | =0.92 | =0.84 | =0.8 | =0.9 | =0.9 | =0.68 |
| Slice 3mm | =0.55 | =0.68 | =0.77 | =0.9 | =0.03 | =0.68 |
| Slice 5mm | =0.02 | =0.03 | =0.22 | =0.8 | =0.8 | =0.4 |
| Mean | =0.003 | =0.01 | =0.14 | =0.002 | <0.0001 | =0.87 |
| Dose*slice | =0.7 | =0.85 | =0.89 | =0.1 | =0.18 | |
The overall analysis found no significant (p=0.25) influence of slice thickness on the correct findings for GGOs for reader 1. In detail, the 2mm slice thickness resulted in a p-value of 1, 3mm and 5mm in p=0.89 and p=0.19, respectively. The combined evaluation of reader 1 and reader 2 confirmed the findings, that a slice thickness of 3mm showed no significant difference (p=0.55).
Honey combing (HC)The overall analysis found a significant (p=0.002 and p<0.0001, respectively) influence of dose on the correct findings for HC. In detail, for reader 1 the second and third dose level were not significantly different (p=0.29 and p=0.11, respectively), while dose level four showed significant difference (p=0.002). For the combined evaluation the second dose level was borderline not significantly different (p=0.55).
The overall analysis for reader 1 found no significant (p=0.30) influence of slice thickness on the correct findings for HC. In detail, the 2mm slice thickness resulted in a p-value of 1, 3mm and 5mm in p=1 and p=0.86, respectively. For reader 2 and the combined analysis a slice thickness of 3mm showed no significant difference on the evaluation of HC, p=0,64 and p=0.68, respectively.
Reticulation (RET)The overall analysis found no significant (p=0.38) influence of dose on the correct findings for reticulation (Fig. 2). In detail, for reader 1 the second dose level was not significantly different (p=0.86), dose level three and four showed p-values of 0.85 and p=0.14, respectively. For reader 2, all reduced dose levels showed a significant difference (p<0.0001).
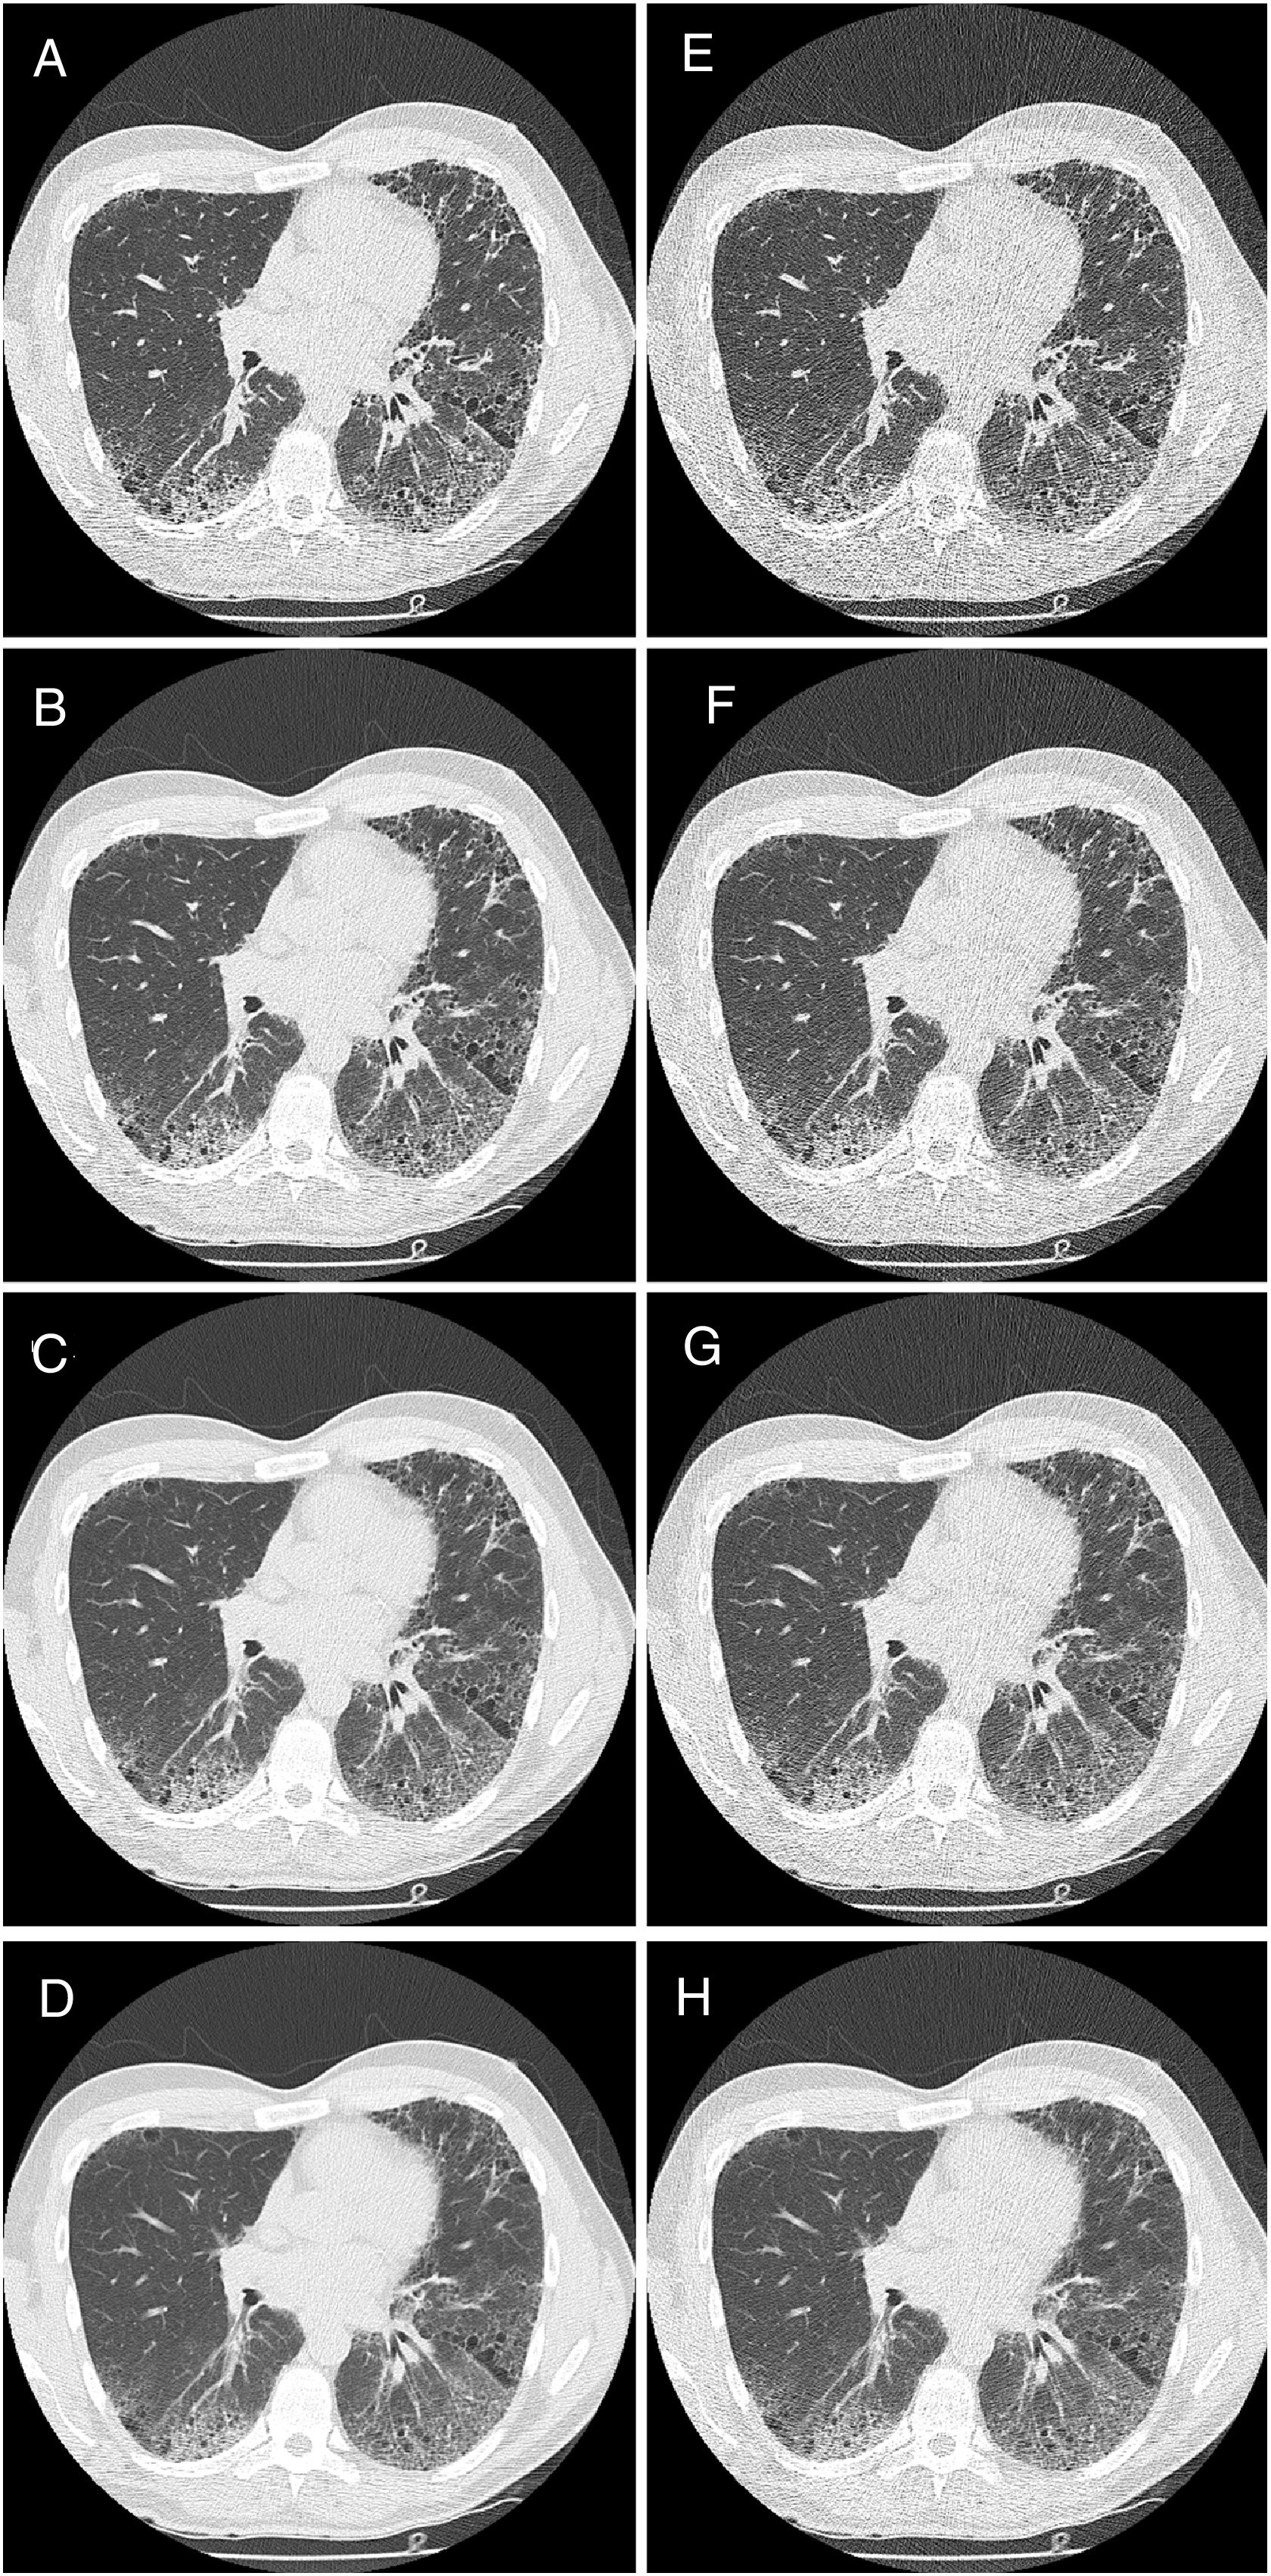
 and simulated 10mA settings (E–H); images are displayed with W/L: 1600/−600HU. 1mm slice thickness (A and E), 2mm slice thickness (B and F), 3mm slice thickness (C and G) and 5mm slice thickness (D and H).")
The overall analysis (reader 1) found no significant (p=0.59) influence of slice thickness on the correct findings for reticulation. In detail, the 2mm slice thickness resulted in a p-value of 1, 3mm and 5mm in p=0.98 and p=0.94, respectively. For reader 2 the slice thickness had no significant impact on detection rate (mean p=0.14).
Total disease extendThe overall analysis found a significant (p<0.0001 and p=0.02, respectively) influence of dose on the correct findings for total disease extend. In detail, for reader 1 the second dose level was not significantly different (p=0.61), dose level three and four showed p-values of <0.0001 and p<0.0001, respectively.
The overall analysis found a significant (p=0.024 and p=0.003, respectively) influence of slice thickness on the correct total disease extend. In detail, for reader 1 the 2mm slice thickness resulted in a p-value of 1, 3mm and 5mm in p=0.98 and p=0.017, respectively.
Image qualityThe overall analysis found a significant (p<0.0001) influence of dose on image quality. In detail, was the second dose level significantly different (p<0.0001), dose level three and four showed p-values of <0.0001 and p<0.0001, respectively.
The overall analysis found a significant (p<0.0001) influence of slice thickness on image quality for both readers. In detail, for reader 1 the 2mm slice thickness resulted in a p-value of =0.08, 3mm and 5mm in p<0.001 and p=0.0002, respectively.
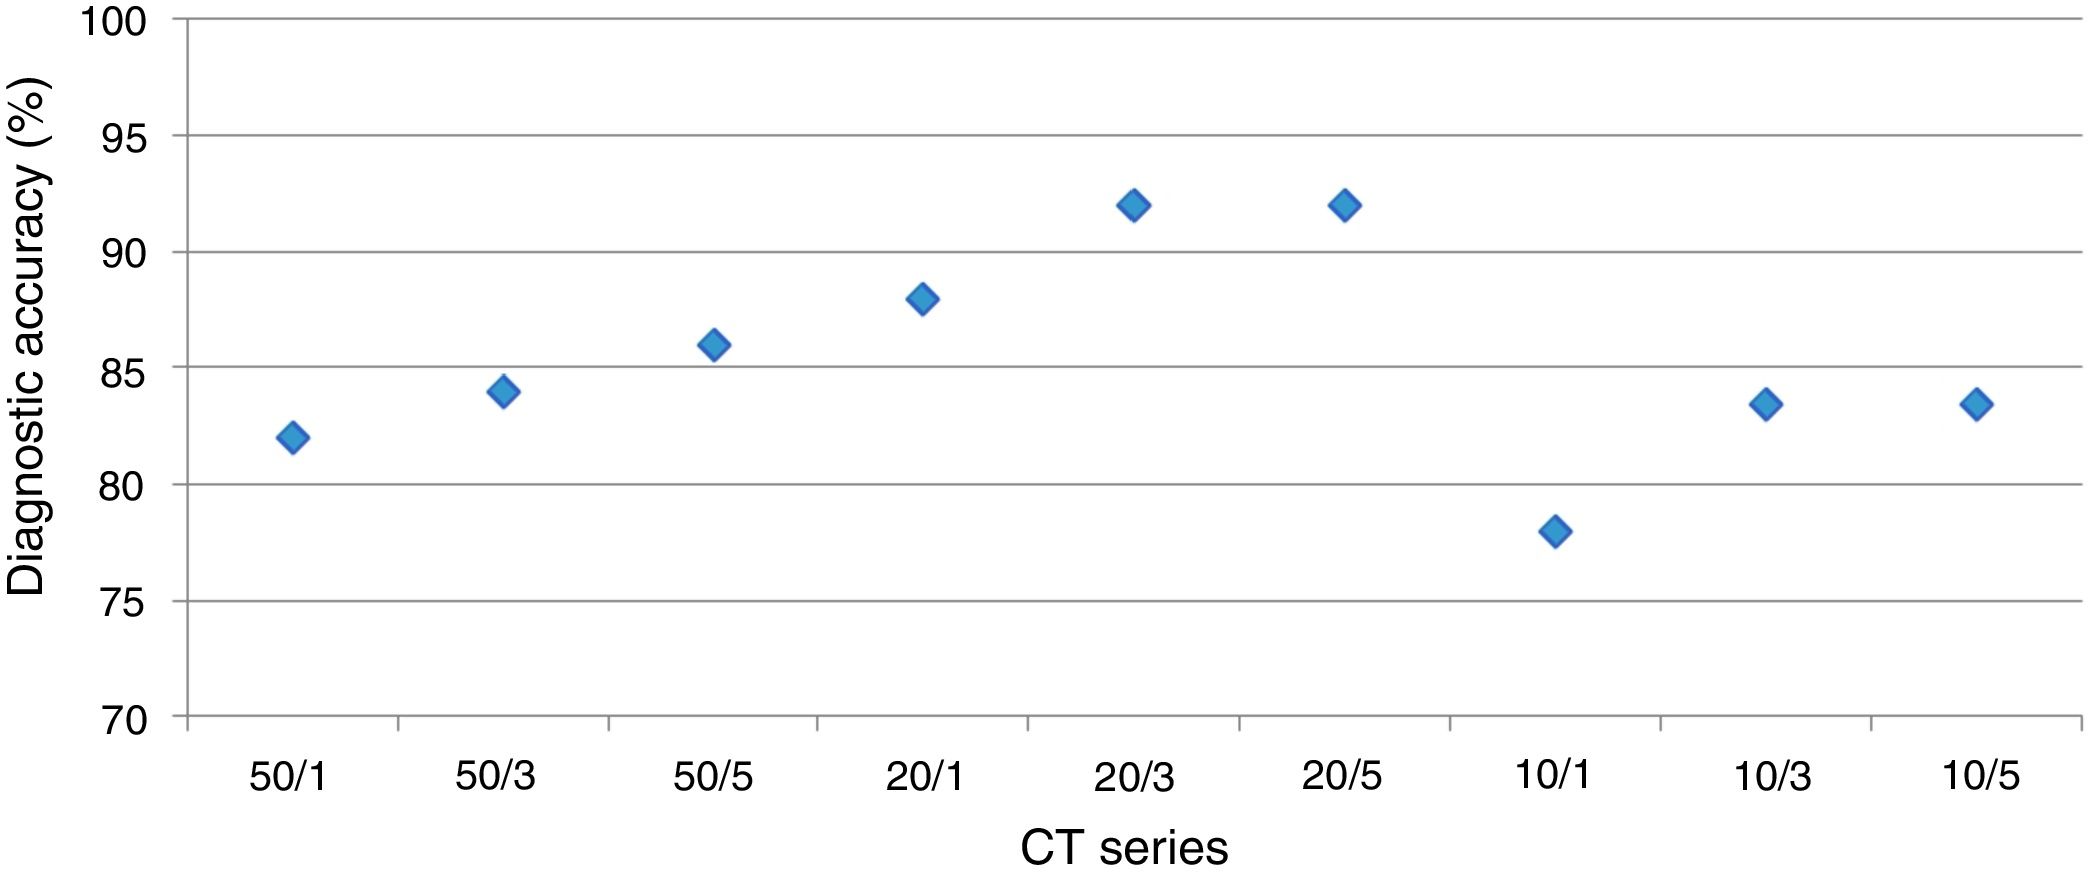
DiagnosisUsing a logistic regression model the likelihood for establishing the correct diagnosis was calculated (Fig. 3).
/millimetres (mm).")
The overall analysis found no significant (p<0.36 and p=1, respectively) influence of dose on establishing the diagnosis. In detail, for reader 1 the second dose level was not significantly different (p=1), dose level three and four showed p-values of =0.57 and p=0.12, respectively.
The overall analysis found no significant (p=0.77 and p=1, respectively) influence of slice thickness on establishing the diagnosis. In detail, for reader 1 the 2mm slice thickness resulted in a p-value of =0.6, 3mm and 5mm in p=0.6 and p=0.29, respectively.
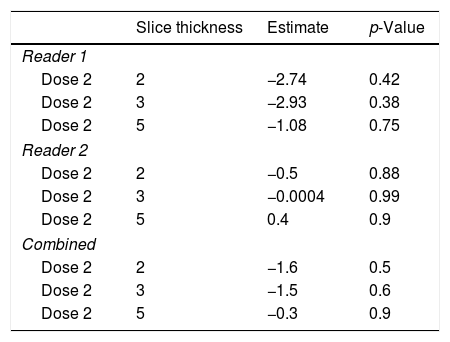
Optimal LDCT seriesThe mixed model analysis allows for a combined analysis of dose and slice settings. The estimate of the linear model provides the offset compared to the optimal dataset; the closer this value is to zero, the better.
By using the aforementioned data, it was obvious that a dose level less than 2 leads to significant errors in rating of GGO and total disease extend. Therefore, this specific analysis was tailored to the slice thickness (Table 5). Using this approach, the least estimate (least difference from the original data set) was found for a combination of dose level 2 and slice thickness 5mm for reader 1 and 3mm for reader 2.
Specific analysis of the influence of slice thickness on diagnostic accuracy. As ground glass opacities were the most susceptible parameter for the influence of reduced dose this parameter was chosen. For reader 1 and the combined analysis the estimate is closest to zero with the highest slice thickness of 5mm, while 2mm and 3mm slice thickness were equal. For reader 2, a slice thickness of 3mm showed the best sensitivity for detection of ground glass opacities in a reduced dose setting.
| Slice thickness | Estimate | p-Value | |
|---|---|---|---|
| Reader 1 | |||
| Dose 2 | 2 | −2.74 | 0.42 |
| Dose 2 | 3 | −2.93 | 0.38 |
| Dose 2 | 5 | −1.08 | 0.75 |
| Reader 2 | |||
| Dose 2 | 2 | −0.5 | 0.88 |
| Dose 2 | 3 | −0.0004 | 0.99 |
| Dose 2 | 5 | 0.4 | 0.9 |
| Combined | |||
| Dose 2 | 2 | −1.6 | 0.5 |
| Dose 2 | 3 | −1.5 | 0.6 |
| Dose 2 | 5 | −0.3 | 0.9 |
In this study, we set out to establish an optimal LDCT protocol for the most common forms of chronic ILD, UIP and NSIP, by systematically evaluating LDCT imaging series with varying tube current and image slice thickness for differences in operating characteristics and imaging features. The evaluation was done with 2 readers, one experienced chest radiologist and one resident. A LDCT imaging series with 20mA tube current (SD 30, respectively) and 3–5mm slice thickness was most optimal, upholding diagnostic accuracy for pattern detection while delivering the lowest radiation dose. Further reductions in tube current to 10mA resulted in significant reductions in image quality and increased estimation of disease extent, GGO and reticulation. These preliminary results provide support for applying a specific LDCT protocol in patients with common forms of ILD in larger, prospective studies.
Previous CT protocol studies comparing 150mA versus 40mA have found reduced sensitivity in detecting ILD imaging features, including interstitial opacities, reticulation, and GGO at lower tube currents.14 We found estimated GGO, reticulation and disease extent to increase significantly with reductions in tube current to 10mA. This is suspected to be as a consequence of reduced image quality with lower tube current, interpreted as an exaggerated burden of diseased lung. Image quality was also reduced in 1mm slice series’, compared with 3mm and 5mm, suggesting a higher number of images at low tube currents results in increased noise. Interestingly, we found little difference in disease extent and other imaging features between 50mA and 20mA series’, suggesting a threshold exists, beyond which noise influences imaging feature interpretation. Accurately measuring disease extent on CT imaging is important, as it has been shown to predict functional decline and mortality in both CTD-ILD and IPF.18,19
The diagnostic accuracy of HRCT is quoted between 90 and 100% for UIP and 65 and 90% for NSIP, based on studies employing surgical-lung biopsy confirmation.6,20,21 However, no studies have evaluated the diagnostic accuracy of LDCT imaging for distinguishing UIP and NSIP in comparison to HRCT. We found comparable agreement, sensitivity and specificity between all LDCT series for ILD pattern in comparison to HRCT. However, diagnostic accuracy was highest in 20mA tube current series. This likely represents how challenging it can be to differentiate UIP and NSIP patterns, regardless of imaging protocol. A central feature in differentiating UIP and NSIP is the presence and extent of HC. We found no difference between LDCT series’ in the reported extent of HC, which may explain why operating characteristics were preserved in the 20mA series.
We compared LDCT series for diagnostic accuracy, image quality and estimated radiation dose to identify the optimal CT parameters. Diagnostic accuracy was felt to be the operating characteristic of principal importance, given it strongly influences the clinical diagnosis and decisions to initiate or withhold immunomodulating therapy. Image quality influences radiologist interpretation of imaging features. We found GGO, reticulation and disease extent to be highest in the 10mA series, which had the worst image quality. We suspect this is because increased noise leads to an exaggerated quantification of these imaging features. These preliminary results suggest protocols applying 10mA tube current or less should be avoided, as this could lead to an overestimation of disease extent, and influence projected prognosis. We found the 20mA/5mm series to have the best balance of maintaining operating characteristics, while minimizing radiation exposure. However, given the detailed results for each parameter, it appears, that a slice thickness of 3mm would show even less differences for the individual disease features.
Although there were only 28 subjects involved in this study, each CT performed was used to generate multiple data sets. Comparisons between LDCT series for the same patient removes individual inconsistencies (i.e. differences in breath holding) ensuring only protocol changes influenced CT interpretation. We limited our population to those with UIP and NSIP. This was done to create a homogeneous cohort, but limits the applicability of this protocol to ILD patients with other radiographic patterns. That said, IPF is the most common form of ILD and the approach to interpreting radiographic UIP outlined in ATS guidelines are often applied to those with undefined ILD [Raghu, 2011 #4452].4
Our results suggest that LDCT imaging may accurately distinguish and characterize radiographic UIP and NSIP. A threshold appears to exist for LDCT parameters, below which operating characteristics are compromised. Most of the CT scanners use software-based dose modulation techniques for optimization of the image quality and radiation dose exposure. The dose limits can be adjusted be the user. In case an examination is too low dose due to a challenging body habitus, our results indicate, that it is possible to use even 3–5mm slice thickness for compensation of the noise without losing the diagnostic capability of the examination (and to avoid re-scan). Additional studies investigating the diagnostic utility of various LDCT protocols in ILD are required.
Clinical relevance
- •
Low-dose CT imaging for diagnostic characterization of typical ILD changes with 20mA possible.
- •
Slice thickness of 3mm (increment 2.4mm) and even 5mm (increment 4mm) does not impair evaluation of interstitial lung disease.
Own funding, no external funding.
Conflicts of interestNone declared.
We would like to thank Hatem Mehrez for data preparation, and Antonio Cassano for help with the manuscript revision and submission process.
Statistical analysis was performed by Dr. A. Crispin (The Institute for Medical Information Processing, Biometry, and Epidemiology; LMU Munich).


