


Pleuroparenchymal fibroelastosis (PPFE) is a clinicopathological and radiological entity characterized by dense pleural and subpleural fibrosis, and elastic fibers deposition1,2 which, in a certain percentage of cases, manifests with additional changes which can be coexisting IP-like patterns3-5 or chronic infectious disease.6 We investigated if this different radiological presentation of PPFE could be at the basis of peculiar clinical profiles.
A retrospective, single-center, observational analysis (approved by the Ethical Review Board of AUSL Romagna Nr. 30/2020 I.5/284) was carried out. Patients with radiological diagnosis of a definite PPFE or with histological evidence of PPFE biopsy plus compatible CT scan, in the period between 2008 and 2018, were analyzed. The inclusion criteria were: age above 18, availability of volumetric CT scan, complete pulmonary function tests and autoimmunity panel. Data on vital status were collected up to the end 2018 with a follow-up of at least 4 years. Thereafter all patients were contacted in December 2022 to certify the survival status and/or lung transplant.
Radiological analysis, performed in consensus by a chest radiologist (SP) and a pulmonologist expert on imaging (LSF), consisted of the visual scoring of each CT finding.7 Furthermore, patients were subclassified into three groups: CT evidence of standalone PPFE (group I); PPFE plus CT evidence of a coexisting ILD (group II); PPFE plus signs of airway disease (group III) (Fig. 1). Clinical data collected and visual CT analysis are reported in the supplemental materials.
, with surgical biopsy-proven PPFE and severe impairment of PFT (FVC 27% FEV1 25% DLCO 31%). CT scan shows bilateral, dense pleural and subpleural fibrosis suggestive of PPFE, in the upper and mid lung regions. The elastotic tissue is also present in the fissures, with particular evidence for the right one (red arrow). Scattered traction bronchiectasis are present in the surrounding dense elastotic fibrosis. Sixty-seven year-old female (C,D), with diagnosis of familial pulmonary fibrosis. Surgical lung biopsy documented: PPFE + UIP pattern. CT scan shows brobable UIP pattern in both lower lobes, mainly on the right associated with pulmonary ossifications e traction bronchiectasis. Seventy-eight-year-old female (E,F), affected by Sjogren disease, with diagnosis of bronchiolitis Nocardia abscessus related. PPFE is present in both upper lobes associated with centrilobular nodules and mucus plugging in the bronchi in the left lower lobe.")
Thirty-seven year-old male (A,B), with surgical biopsy-proven PPFE and severe impairment of PFT (FVC 27% FEV1 25% DLCO 31%). CT scan shows bilateral, dense pleural and subpleural fibrosis suggestive of PPFE, in the upper and mid lung regions. The elastotic tissue is also present in the fissures, with particular evidence for the right one (red arrow). Scattered traction bronchiectasis are present in the surrounding dense elastotic fibrosis.
Sixty-seven year-old female (C,D), with diagnosis of familial pulmonary fibrosis. Surgical lung biopsy documented: PPFE + UIP pattern. CT scan shows brobable UIP pattern in both lower lobes, mainly on the right associated with pulmonary ossifications e traction bronchiectasis.
Seventy-eight-year-old female (E,F), affected by Sjogren disease, with diagnosis of bronchiolitis Nocardia abscessus related. PPFE is present in both upper lobes associated with centrilobular nodules and mucus plugging in the bronchi in the left lower lobe.
Fifty-three patients (34 women, 19 men, median age 59 years, IQR: 51-72 years), mostly nonsmokers (73.6%), were included in the study. Sixteen of them (30.2 %) with histologic confirmation (7 surgical lung biopsy; 9 transbronchial cryobiopsy). Bronchoalveolar lavage revealed presence of infection in eleven cases: Aspergillus Niger (n=1), Aspergillus Terreus (n=1), Mycobacterium tuberculosis (n=4); Mycobacterium avium-intracellulare (n=2); Haemophilus Influenzae (n=2); and Nocardia abscessus (n=1).
Systemic/autoimmune disorders were demonstrated in nine cases: Hashimoto's thyroiditis (n=2; one in group I and one in group II); Sjogren's disease (n=3), two in group III, one case in group II); undifferentiated collagen vascular disease (n=1, group II); scleroderma (n=1, group II); and rheumatoid arthritis (n=1, group II). Sarcoidosis was present in one (n=1, group II). History of hematologic disorders was present in five cases and, in two of them, PPFE was the manifestation of a chronic graft-versus-host disease.
The radiological analysis revealed that in the standalone PPFE (n= 22) the dense pleural fibrosis was mainly in the upper to middle lung regions (77.3%; n= 17) and only in 22.7% of cases extended to lower lobes (n=5).
PPFE-ILD group (n=19) showed features of PPFE plus: definite UIP (52.6%, n=10), probable UIP (15.8%, n=3), indeterminate UIP (10.5%, n=2), definite HP pattern (15.8%, n=3), and sarcoidosis (5.3%, n=1).
Among these, six patients received a final MDT diagnosis of IPF (with excessive PPFE manifestation); six of familial pulmonary fibrosis; three of fibrosing hypersensitivity pneumonitis, one patient of sarcoidosis, one of diffuse scleroderma, one of RA-ILD, and one of Sjogren's syndrome.
The last group, PPFE-airways disease, had CT findings including signs of bronchiolitis and/or bronchial inflammation. Findings included respectively: centrilobular nodules along with tree-in-bud (50.0%, n= 6) or bronchiectasis, mucus plugging and tree-in-bud (50.0%, n=6).
The three groups showed significant differences in the semiquantitative radiological score, as well.
First, standalone PPFE had significantly higher dense-subpleural fibrosis score (median: 100, IQR: 60-100) compared to group III (median: 90, IQR: 50-100) and group II (median: 56.7, IQR: 40-80) (p = 0.004).
Second, PPFE-ILD had the highest traction bronchiectasis score [median: 7 (IQR: 4-10), compared to 0.5 (IQR 0-2.5) in group III and 0 (IQR: 0-6) the group I (p < 0.001)] and fissural elastotic thickening [(median: 211.4; IQR: 87.7-441.4) compared to group I (median: 64.6; IQR: 13.7-245.2) or group III (median: 103.8; IQR: 19.0-282.4) (p = 0.001)]. Also, the clinical features showed different profiles.
Standalone PPFE patients were younger (mean age: 47.7) than those with PPFE and airways disease (mean: 67.2) and those with PPFE-ILD (mean: 65.2) (p < 0.001).
BMI of the whole group was in the lower normal limits (median value: 20.4; 18.9-23.6); however, comparing the three groups (Group I: 17 IQR 16-21.5; Group II: 21.6 IQR 20.2-26.0; Group III: 20.4 IQR 14.1-22.7), a significant difference was evident between the group I and the group II (p = 0.049): subjects with standalone PPFE were slimmer than those with PPFE-ILD. Moreover, patients in Group I, with BMI ≤17 died (median value 16, IQR 16-17), (n=6), suggesting that a low BMI can be a prognostic determinant.
Median survival was 9 years (95%CI: 7-13 years), with the shortest one documented in the PPFE-ILD group (median 4 years, 95%CI: 3-8 years), followed by the PPFE airways diseases (median 9 years, 95%CI: 7-13 years) and finally the standalone PPFE group (median 9 years, 95%CI: 9-13 years) (log-rank test chi2(2) = 9.93, p = 0.0070).
In conclusion, quoting the incipit of De Bello Gallico, we may start to consider PPFE as a complex entity divisible into three main particular clinical profiles, based on the radiological appearance.
The standalone PPFE is mainly paucisymtomatic and affects mainly middle-aged non-smoker females with a low BMI. The PPFE-ILD, manifests mainly in males with a familial predisposition, in their mid-sixties, with significant restrictive impairment, severe symptoms, and the lowest survival. The PPFE-airway diseases affect older non-smoking females, manifesting with relapsing fever and an underlying infection (Table 1).
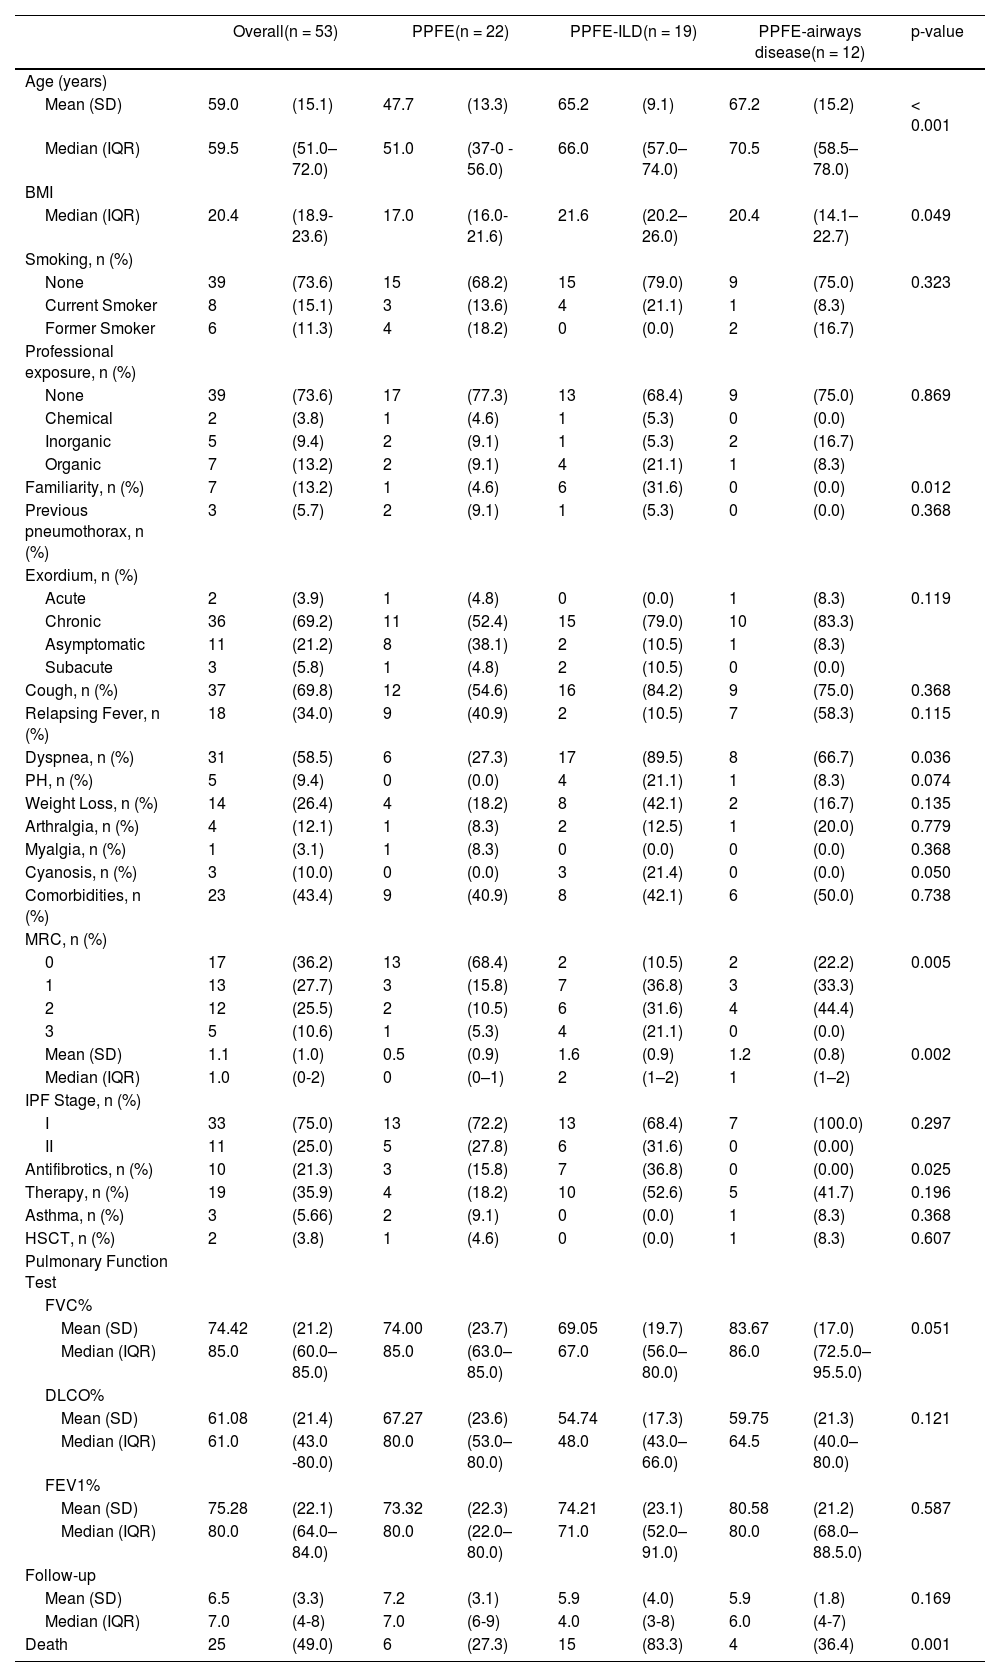
Clinical summary of patients’ characteristics.
| Overall(n = 53) | PPFE(n = 22) | PPFE-ILD(n = 19) | PPFE-airways disease(n = 12) | p-value | |||||
|---|---|---|---|---|---|---|---|---|---|
| Age (years) | |||||||||
| Mean (SD) | 59.0 | (15.1) | 47.7 | (13.3) | 65.2 | (9.1) | 67.2 | (15.2) | < 0.001 |
| Median (IQR) | 59.5 | (51.0–72.0) | 51.0 | (37-0 - 56.0) | 66.0 | (57.0–74.0) | 70.5 | (58.5–78.0) | |
| BMI | |||||||||
| Median (IQR) | 20.4 | (18.9-23.6) | 17.0 | (16.0-21.6) | 21.6 | (20.2–26.0) | 20.4 | (14.1–22.7) | 0.049 |
| Smoking, n (%) | |||||||||
| None | 39 | (73.6) | 15 | (68.2) | 15 | (79.0) | 9 | (75.0) | 0.323 |
| Current Smoker | 8 | (15.1) | 3 | (13.6) | 4 | (21.1) | 1 | (8.3) | |
| Former Smoker | 6 | (11.3) | 4 | (18.2) | 0 | (0.0) | 2 | (16.7) | |
| Professional exposure, n (%) | |||||||||
| None | 39 | (73.6) | 17 | (77.3) | 13 | (68.4) | 9 | (75.0) | 0.869 |
| Chemical | 2 | (3.8) | 1 | (4.6) | 1 | (5.3) | 0 | (0.0) | |
| Inorganic | 5 | (9.4) | 2 | (9.1) | 1 | (5.3) | 2 | (16.7) | |
| Organic | 7 | (13.2) | 2 | (9.1) | 4 | (21.1) | 1 | (8.3) | |
| Familiarity, n (%) | 7 | (13.2) | 1 | (4.6) | 6 | (31.6) | 0 | (0.0) | 0.012 |
| Previous pneumothorax, n (%) | 3 | (5.7) | 2 | (9.1) | 1 | (5.3) | 0 | (0.0) | 0.368 |
| Exordium, n (%) | |||||||||
| Acute | 2 | (3.9) | 1 | (4.8) | 0 | (0.0) | 1 | (8.3) | 0.119 |
| Chronic | 36 | (69.2) | 11 | (52.4) | 15 | (79.0) | 10 | (83.3) | |
| Asymptomatic | 11 | (21.2) | 8 | (38.1) | 2 | (10.5) | 1 | (8.3) | |
| Subacute | 3 | (5.8) | 1 | (4.8) | 2 | (10.5) | 0 | (0.0) | |
| Cough, n (%) | 37 | (69.8) | 12 | (54.6) | 16 | (84.2) | 9 | (75.0) | 0.368 |
| Relapsing Fever, n (%) | 18 | (34.0) | 9 | (40.9) | 2 | (10.5) | 7 | (58.3) | 0.115 |
| Dyspnea, n (%) | 31 | (58.5) | 6 | (27.3) | 17 | (89.5) | 8 | (66.7) | 0.036 |
| PH, n (%) | 5 | (9.4) | 0 | (0.0) | 4 | (21.1) | 1 | (8.3) | 0.074 |
| Weight Loss, n (%) | 14 | (26.4) | 4 | (18.2) | 8 | (42.1) | 2 | (16.7) | 0.135 |
| Arthralgia, n (%) | 4 | (12.1) | 1 | (8.3) | 2 | (12.5) | 1 | (20.0) | 0.779 |
| Myalgia, n (%) | 1 | (3.1) | 1 | (8.3) | 0 | (0.0) | 0 | (0.0) | 0.368 |
| Cyanosis, n (%) | 3 | (10.0) | 0 | (0.0) | 3 | (21.4) | 0 | (0.0) | 0.050 |
| Comorbidities, n (%) | 23 | (43.4) | 9 | (40.9) | 8 | (42.1) | 6 | (50.0) | 0.738 |
| MRC, n (%) | |||||||||
| 0 | 17 | (36.2) | 13 | (68.4) | 2 | (10.5) | 2 | (22.2) | 0.005 |
| 1 | 13 | (27.7) | 3 | (15.8) | 7 | (36.8) | 3 | (33.3) | |
| 2 | 12 | (25.5) | 2 | (10.5) | 6 | (31.6) | 4 | (44.4) | |
| 3 | 5 | (10.6) | 1 | (5.3) | 4 | (21.1) | 0 | (0.0) | |
| Mean (SD) | 1.1 | (1.0) | 0.5 | (0.9) | 1.6 | (0.9) | 1.2 | (0.8) | 0.002 |
| Median (IQR) | 1.0 | (0-2) | 0 | (0–1) | 2 | (1–2) | 1 | (1–2) | |
| IPF Stage, n (%) | |||||||||
| I | 33 | (75.0) | 13 | (72.2) | 13 | (68.4) | 7 | (100.0) | 0.297 |
| II | 11 | (25.0) | 5 | (27.8) | 6 | (31.6) | 0 | (0.00) | |
| Antifibrotics, n (%) | 10 | (21.3) | 3 | (15.8) | 7 | (36.8) | 0 | (0.00) | 0.025 |
| Therapy, n (%) | 19 | (35.9) | 4 | (18.2) | 10 | (52.6) | 5 | (41.7) | 0.196 |
| Asthma, n (%) | 3 | (5.66) | 2 | (9.1) | 0 | (0.0) | 1 | (8.3) | 0.368 |
| HSCT, n (%) | 2 | (3.8) | 1 | (4.6) | 0 | (0.0) | 1 | (8.3) | 0.607 |
| Pulmonary Function Test | |||||||||
| FVC% | |||||||||
| Mean (SD) | 74.42 | (21.2) | 74.00 | (23.7) | 69.05 | (19.7) | 83.67 | (17.0) | 0.051 |
| Median (IQR) | 85.0 | (60.0–85.0) | 85.0 | (63.0–85.0) | 67.0 | (56.0–80.0) | 86.0 | (72.5.0–95.5.0) | |
| DLCO% | |||||||||
| Mean (SD) | 61.08 | (21.4) | 67.27 | (23.6) | 54.74 | (17.3) | 59.75 | (21.3) | 0.121 |
| Median (IQR) | 61.0 | (43.0 -80.0) | 80.0 | (53.0–80.0) | 48.0 | (43.0–66.0) | 64.5 | (40.0–80.0) | |
| FEV1% | |||||||||
| Mean (SD) | 75.28 | (22.1) | 73.32 | (22.3) | 74.21 | (23.1) | 80.58 | (21.2) | 0.587 |
| Median (IQR) | 80.0 | (64.0–84.0) | 80.0 | (22.0–80.0) | 71.0 | (52.0–91.0) | 80.0 | (68.0–88.5.0) | |
| Follow-up | |||||||||
| Mean (SD) | 6.5 | (3.3) | 7.2 | (3.1) | 5.9 | (4.0) | 5.9 | (1.8) | 0.169 |
| Median (IQR) | 7.0 | (4-8) | 7.0 | (6-9) | 4.0 | (3-8) | 6.0 | (4-7) | |
| Death | 25 | (49.0) | 6 | (27.3) | 15 | (83.3) | 4 | (36.4) | 0.001 |


