
1) to compare the QIAreachTM QuantiFERON-TB (QIAreach QFT) vs. QuantiFERON®-TB Gold Plus assay (QFT-Plus) to detect tuberculosis (TB) infection; 2) to evaluate diagnostic sensitivity of QIAreach QFT using active TB as surrogate for TB infection; 3) to preliminarily evaluate QIAreach QFT in immunocompromised individuals.
MethodsQIAreach QFT measures the level of interferon-γ (IFN-γ) in plasma specimens from blood stimulated by ESAT-6 and CFP-10 peptides in one blood collection tube (equivalent to the TB2 tube of the QFT-Plus). QIAreach QFT was applied to plasma samples from 41 patients with pulmonary TB and from 42 healthy or low-TB-risk individuals.
ResultsSensitivity and specificity of QIAreach QFT vs. QFT-Plus were 100% (41/41) and 97.6% (41/42), respectively; overall concordance was 98.8% (82/83). All samples were measured within 20 min. The time to result of each sample was significantly correlated with IFN-γ level with a natural logarithmic scale (r = -0.913, p < 0.001). Seven cases in the active TB group were immunocompromised (CD4 <200/μL) and tested positive by QIAreach QFT.
ConclusionsQIAreach QFT provides an objective readout with a minimum blood sample volume (1 mL/subject), potentially being a useful point-of-care screening test for TB infection in high-TB-burden, low-resource countries and for immunocompromised patients.
Tuberculosis (TB), the world's leading cause of death due to a single infectious agent, Mycobacterium tuberculosis, is one of the top-ten causes of preventable death globally.1 The World Health Organization (WHO) estimates that in 2019 alone, around 10 million people suffered from TB and 1.4 million people died from the disease,1 with one-third of humans having M. tuberculosis infection.2
Diagnosis and treatment of TB infection are core conceptual elements of the TB elimination strategy,3-6 as reflected in WHO's emphasis on TB prevention in its End TB Strategy.1
Few tests are available to detect TB infection. The century-old tuberculin skin test (TST) is based on delayed type hypersensitivity reaction in the skin upon intradermal injection of purified protein derivative (PPD) from mycobacterial culture. Although TST is still widely utilized, it has several limitations7-12 that interferon-γ (IFN-γ) release assays (IGRAs) have been developed to overcome.13 IGRAs are in vitro blood assays that measure the levels of IFN-γ released by T lymphocytes stimulated with antigenic peptides of M. tuberculosis.3,4,12-17 Two WHO-endorsed IGRAs are commonly used to detect TB infection: T-SPOT®.TB (Oxford Immunotec, Abingdon, UK) and QuantiFERON®-TB Gold Plus (QFT-Plus, QIAGEN, Hilden, Germany).18,19 The QFT-Plus assay, the fourth generation of QuantiFERON®-TB, is designed to measure IFN-γ released by both CD4 and CD8 T cells.20,21 To date, both WHO-endorsed IGRA tests need quality laboratory support, potentially limiting their use in peripheral and/or limited resource settings.
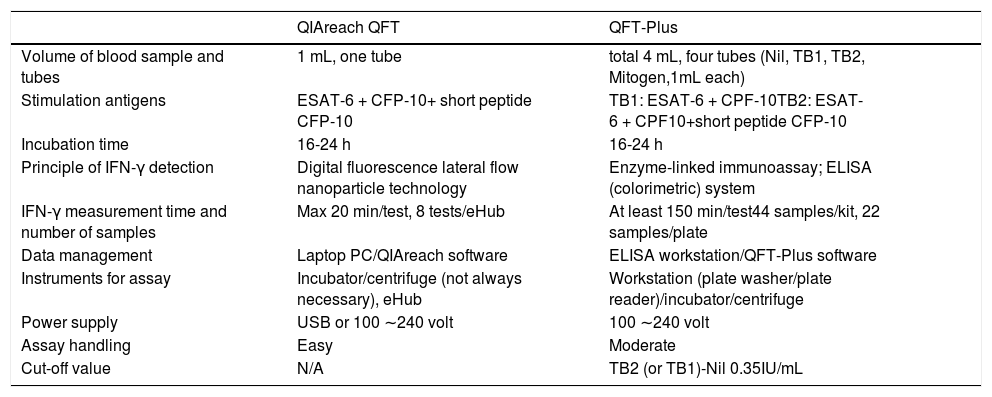
Lateral flow immunoassays (LFAs) are portable, easy to use outside specialized laboratory environments, and provide a quick readout, making them ideal point-of-care (POC) tests.22 QIAGEN has recently developed a new diagnostic test for TB infection, the QIAreachTM QuantiFERON-TB (QIAreach QFT) assay. This novel digital fluorescence LFA uses nanoparticle technology to measure the levels of IFN-γ in plasma released from both CD4 and CD8 T cells, thus eliminating the need for enzyme-linked immunosorbent assay (ELISA).23 QIAreach QFT, which uses the same test tube as the TB2 tube of QFT-Plus, is an easy-to-use rapid test requiring less instrumentation and blood volume than QFT-Plus. Key characteristics of the QIAreach QFT assay compared to QFT Plus are presented in Table 1.
Comparison of QIAreach QFT and QFT-Plus.
ELISA: enzyme-linked immunosorbent assay; ESAT-6: early secretory antigenic 6 kDa; CFP-10: culture filtrate protein 10.
No previous study has compared the new QIAreach QFT test against the established (FDA-approved and CE-marked) QFT-Plus test in detecting TB infection. Furthermore, the potential role of QIAreach QFT as a diagnostic test for TB infection has never before been evaluated.
The aims of this study were to 1) compare the QIAreach QFT and QFT-Plus tests to detect TB infection; 2) evaluate the clinical performance of QIAreach QFT for detection of TB infection by analyzing plasma samples from patients with active TB disease and healthy or low-TB-risk individuals in a clinical setting; and 3) conduct a preliminary evaluation of the QIAreach QFT test in immunocompromised individuals.
Material and methodsStudy subjectsThis study was conducted at the Nagasaki Genbaku Isahaya Hospital, a Nagasaki Prefecture-designated TB hospital in Japan. Plasma samples were collected from consenting individuals with active TB (September 2019-October 2020) and from healthy low-TB-risk individuals (August-October 2020). The research protocols for this study were approved by the Institutional Review Board of the Nagasaki Genbaku Isahaya Hospital (approval IRB no.138). Written informed consent was obtained from all recruited subjects.
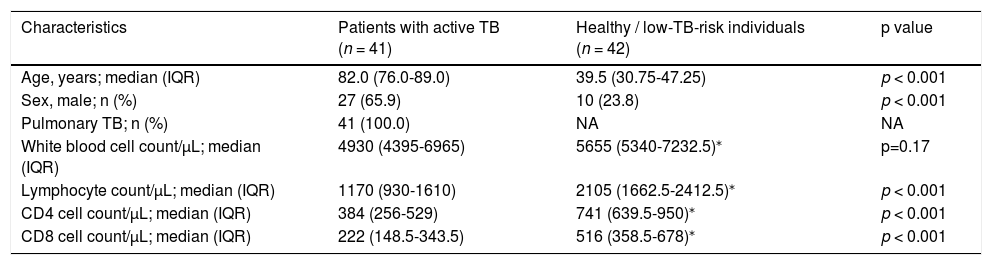
Clinical and demographic data collected from patients included age, gender as well as key white blood cell count parameters (Table 2). Adult patients aged ≥20 years with active pulmonary TB were included in the study if they presented signs and symptoms compatible with TB, imaging (chest radiography and high-resolution computed tomography) compatible with the disease, and met one or both of the following criteria: 1) sputum-culture positive for M. tuberculosis and/or 2) TB nucleic acid amplification test-positive specimens tested using polymerase chain reaction or loop-mediated isothermal amplification. Study participants with active TB either had not been treated for TB or had received anti-TB drugs for a maximum 14 days. Healthy low-TB-risk study participants were 1) adults aged 20-65 years, 2) had never taken any anti-TB medication, 3) had no history of contact or exposure to TB, 4) had not lived or stayed in an area or country with a TB incidence rate of >50/100,000 for >1 month, 5) had no immunodeficiencies such as human immunodeficiency virus infection, malignancy, diabetes mellitus, and treatment with steroids or immunosuppressant drugs.
Characteristics of study participants with active pulmonary TB and healthy low-TB-risk individuals.
| Characteristics | Patients with active TB (n = 41) | Healthy / low-TB-risk individuals (n = 42) | p value |
|---|---|---|---|
| Age, years; median (IQR) | 82.0 (76.0-89.0) | 39.5 (30.75-47.25) | p < 0.001 |
| Sex, male; n (%) | 27 (65.9) | 10 (23.8) | p < 0.001 |
| Pulmonary TB; n (%) | 41 (100.0) | NA | NA |
| White blood cell count/μL; median (IQR) | 4930 (4395-6965) | 5655 (5340-7232.5)⁎ | p=0.17 |
| Lymphocyte count/μL; median (IQR) | 1170 (930-1610) | 2105 (1662.5-2412.5)⁎ | p < 0.001 |
| CD4 cell count/μL; median (IQR) | 384 (256-529) | 741 (639.5-950)⁎ | p < 0.001 |
| CD8 cell count/μL; median (IQR) | 222 (148.5-343.5) | 516 (358.5-678)⁎ | p < 0.001 |
Data are presented as No. (%), or median (IQR).
TB: tuberculosis; IQR: interquartile range; CD4: CD4+ T lymphocyte in blood; CD8: CD8+ T lymphocyte in blood.
CD4 and CD8 T-cells in participants’ peripheral blood were quantified using flow cytometry as a part of their routine diagnostic management. Assays were performed on CELL-DYN Sapphire Hematology Analyzer (Abbott Co., USA) using proprietary CD3/4/8 monoclonal antibody panels with automated gating.
QFT-Plus assayFor QFT-Plus test, 4 mL of whole blood was taken from all study participants directly into QFT-Plus blood collection tubes. After centrifugation, plasma specimens were harvested and stored at -30°C for later analysis as per manufacturer's guidelines (QIAGEN GmbH, Hilden, Germany). The results of the QFT-Plus test, given as a measurement of IFN-γ, were expressed as IU/mL.
QIAreach QFT assayOne mL of whole blood was taken from all study participants directly into the QIAreach QFT blood collection tube (equivalent to the TB2 tube of the QFT-Plus). Upon centrifugation as per manufacturer's guidelines, plasma was transferred to a microtiter tube and kept frozen at -30°C until testing. Upon thawing the specimens, plasma specimens were centrifuged again at 3000 × g for 15 min and tested according to the manufacturer's instructions.
Prior to starting the assay, QIAreach-Software-x64-1.1.12.0 was installed on a computer running the Microsoft Windows operating system. A charged eHub, connected to the computer via USB cable, was powered on and the eStick was inserted into the eHub's port. Once connected and turned on, both the eHub and the computer software reported that the eHub was in ready mode. A total of 150 µL of diluent buffer was added to the processing tube. Next, 150 µL of plasma specimen was transferred into the same processing tube. The resulting solution was mixed by pipetting up and down at least four times. A total of 150 µL of this mixture was aliquoted from the processing tube into the sample port of the inserted eStick. The assay began automatically, with the status displayed on both the eHub and the computer upon sensing the mixture. Upon assay completion, the test result (+ or -) and time to result (TTR) were indicated on both the eHub and the software.
Statistical analysisData were statistically analyzed using the IBM® SPSS® Statistics V27 for Windows (IBM Corp., USA) and presented as No (%) or median (interquartile range) unless otherwise specified. Sensitivity (positive rate), specificity (negative rate) and overall concordance (proportion of true results overall) of QIAreach QFT were calculated using QFT-Plus as a reference standard. Culture-positive patients were considered the gold standard when evaluating the sensitivity of QIAreach as a tool for detecting TB infection. A sub-analysis was also conducted on samples from immunocompromised patients (CD4 cell counts <200/µL). A Mann-Whitney U test is performed for differences of CD4 or CD8 cell counts in the peripheral blood between active TB and healthy low-TB-risk individuals. Linear regression analysis was performed to examine the relationship between the TTR (second) and the IFN-γ levels (IU/mL). A p-value of less than 0.05 was considered statistically significant.
ResultsCharacteristics of study participantsClinical information about the study subjects is shown in Table 2. The 41 study participants with active pulmonary TB were median aged 82 years (interquartile range, 76.0-89.0) with median CD4 count: 384 cells/μL (interquartile range, 256-529) and median CD8 count: 222 cells /μL (interquartile range, 148.5-343.5). Both the CD4 and CD8 cell counts of active TB patients were significantly lower than those of the healthy individuals (p < 0.001 for both comparisons). Of the 41 patients recruited, 7 were classified as immunocompromised; differences in cell counts between active TB patients and controls maintained with removal of 7 immunocompromised patients.
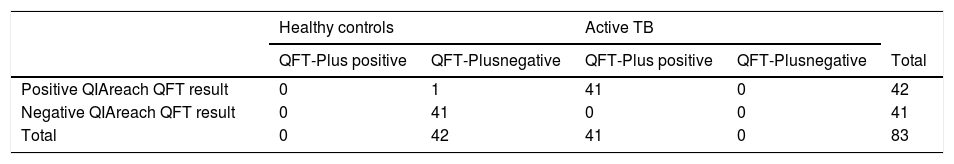
Sensitivity, specificity and concordance of QIAreach QFT TB compared with QFT-PlusPlasma samples from 41 active TB patients and 42 healthy or low-TB-risk individuals were tested. The QIAreach QFT and QFT-Plus ELISA tests were simultaneously conducted on the same samples. Test results are shown in Table 3.
Diagnostic performance of QIAreach QFT assay using QFT-Plus assay as a reference standard.
Sensitivity: 100.0% (41/41); specificity: 97.6% (41/42); overall concordance: 98.8% (82/83).
Using the QIAreach QFT assay, 100% sensitivity and 97.6% specificity (95%CI: 92-100% and 88-99%, respectively) were achieved, with overall concordance of 98.8% (95%CI: 94-100% and kappa coefficient = 0.976) (Table 3). Six specimens had uncorrected TB2 tube values without Nil subtraction below 1 IU/ml (ranging from 0.46 to 0.77) on QFT-Plus and all tested positive on QIAreach QFT (Fig. 1.1 A). All specimens tested negative on QIAreach had TB1-Nil and TB2-Nil values below 0.2 on QFT-Plus.
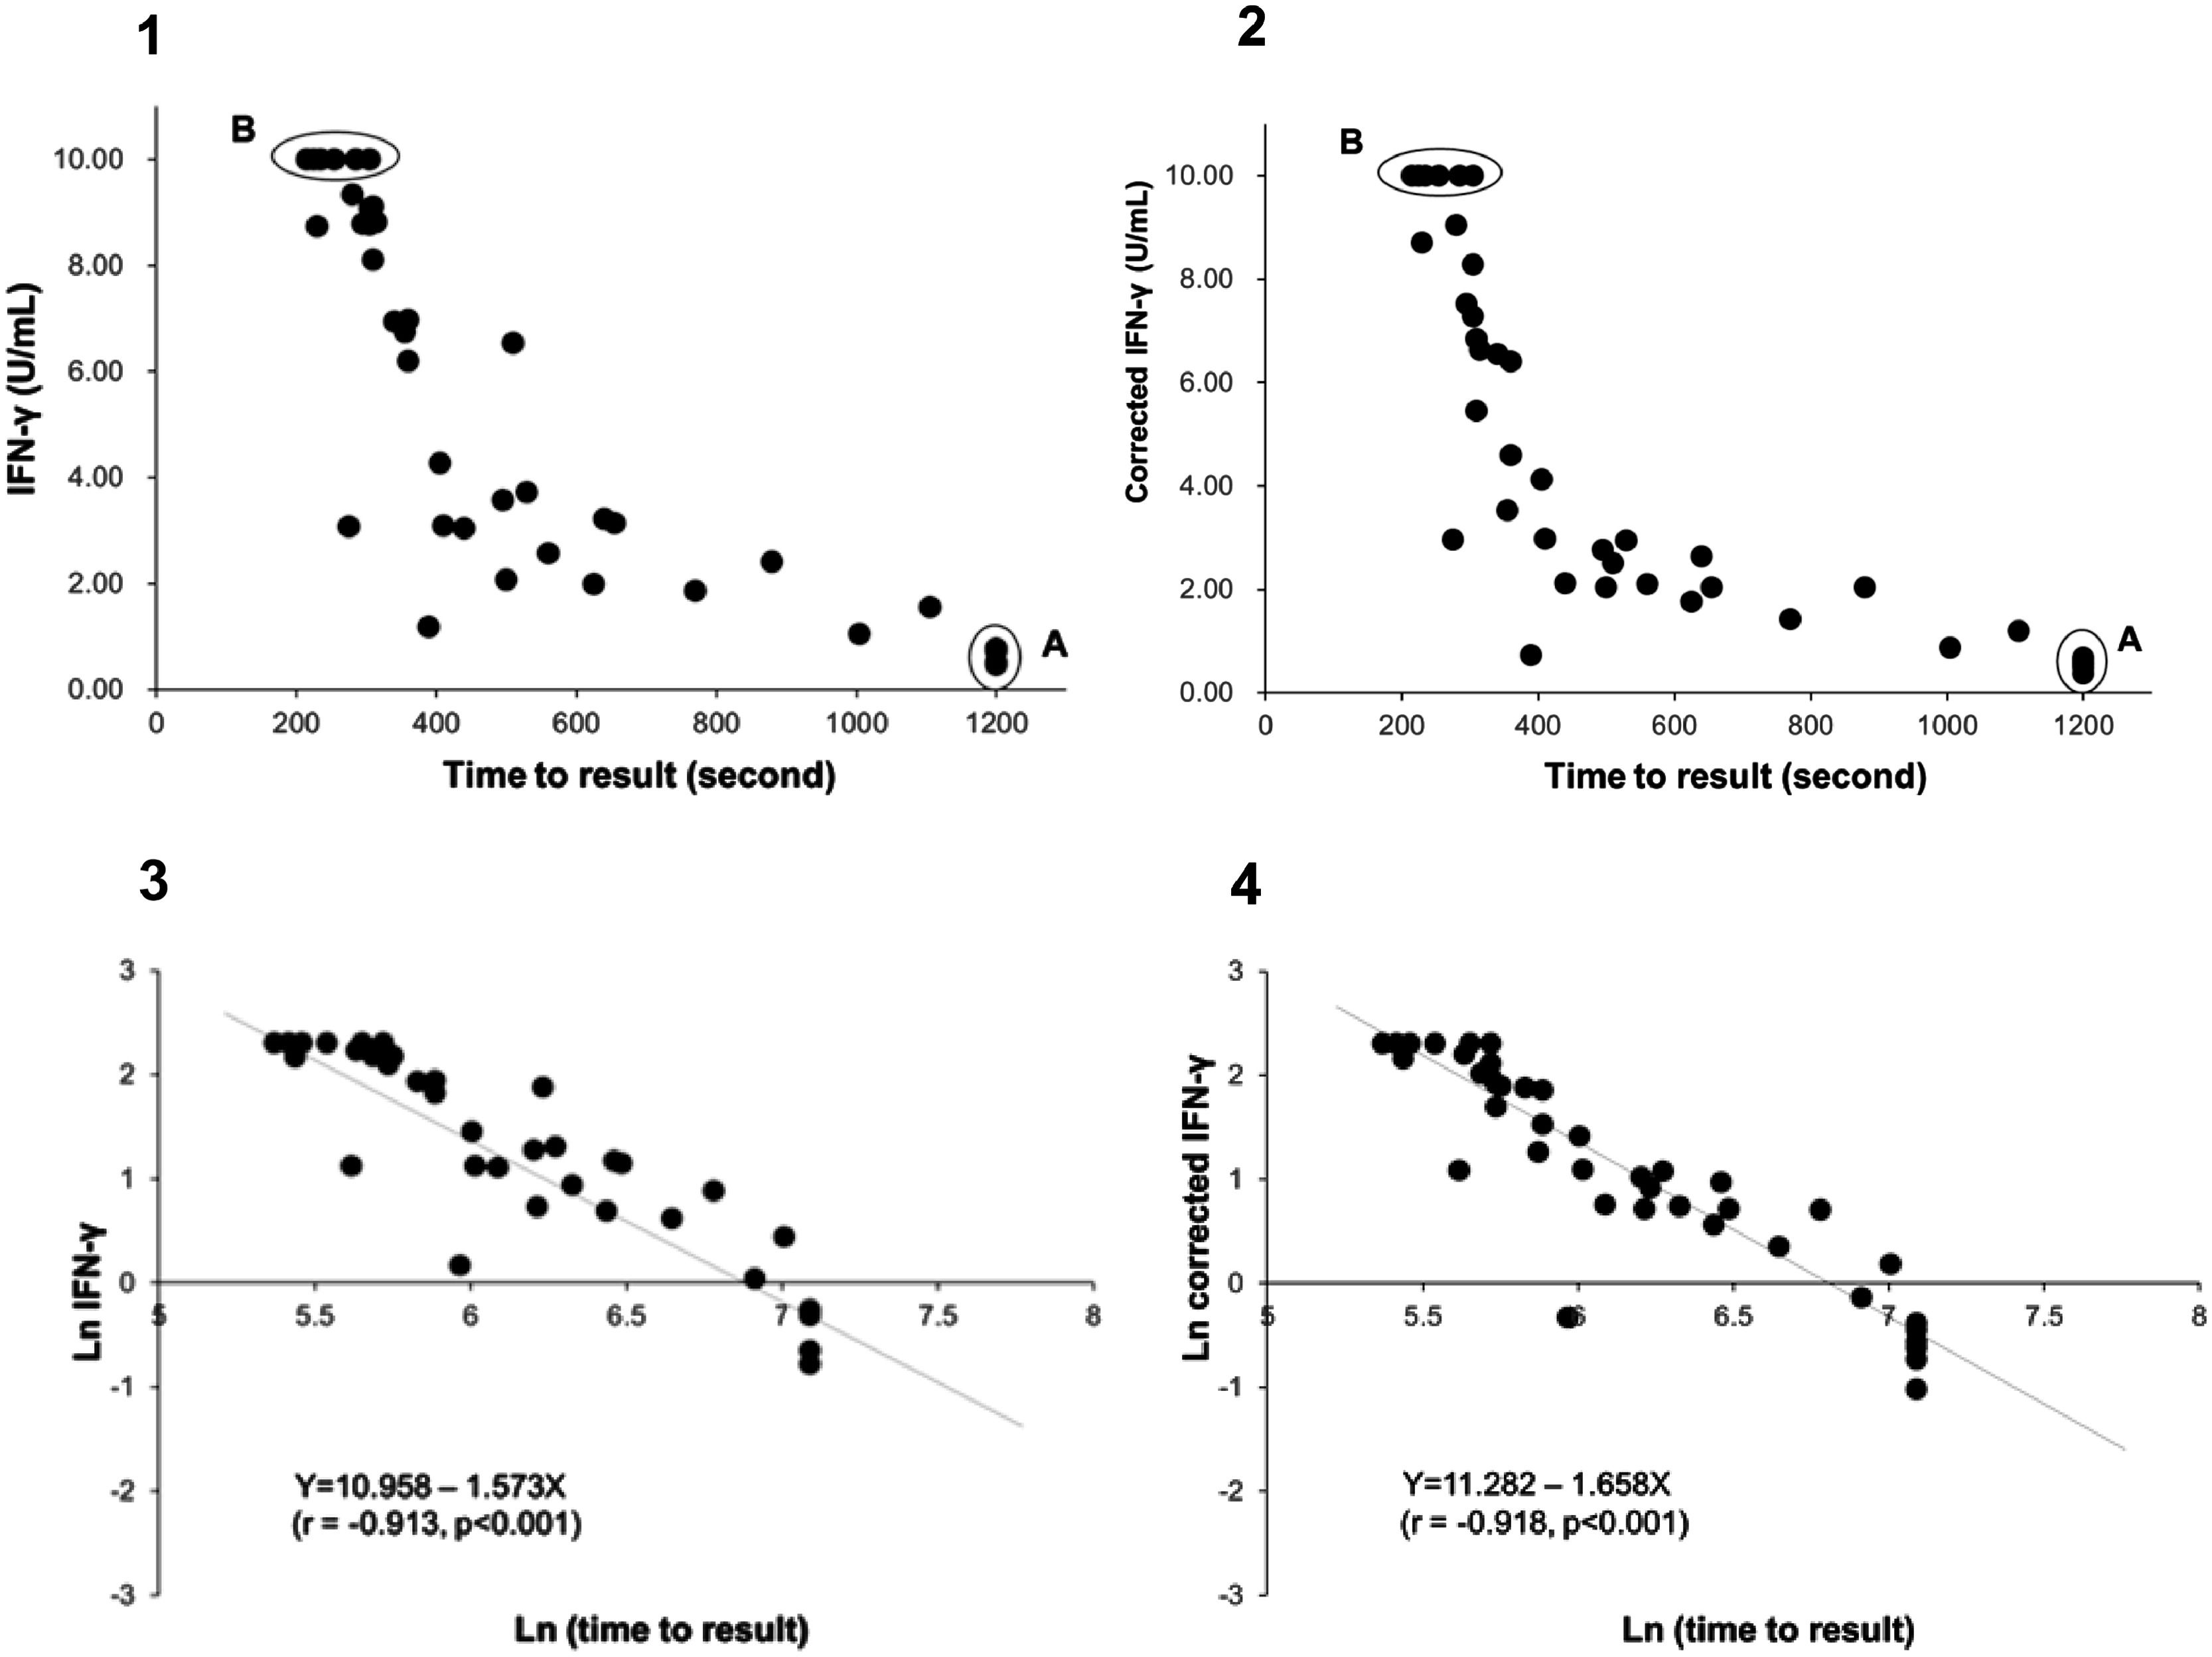
 versus TTR for positive samples (n = 41 active TB patients) 1 – uncorrected values; 2– corrected IFN-γ values; 3– natural logarithm converted uncorrected values; 4– natural logarithm converted corrected IFN-γ values Fig. 1.1A: Six samples with IFN-γ levels (uncorrected TB2 values) between 0.46-0.77 IU/mL (median: 0.75 IU/mL) and time to result of 1200 s. Fig. 1.2A Corrected TB2 values ranging between 0.36 and 0.68 IU/mL (median: 0.555 IU/mL) Fig. 1.1B and 1.2B: Six samples with IFN-γ levels >10 IU/mL (uncorrected and correctedTB2 values) and time to result between 215-305 s (median: 245 s). Data transformation of TTR and IFN-γ of uncorrected and corrected TB2 values to a natural logarithmic scale showed a significantly high correlation (r = -0.913, p < 0.001 and r = -0.918, p < 0.001, respectively) between IFN-γ levels and TTR by linear regression analysis (Fig. 1.3 and 1.4). Corrected IFN-γ (Fig. 1.2) means IFN-γ levels with Nil subtraction. IFN-γ: interferon-γ; TB: tuberculosis.")
Distribution plot and correlation analysis using plasma IFN-γ values (uncorrected and corrected TB2 values) versus TTR for positive samples (n = 41 active TB patients)
1 – uncorrected values; 2– corrected IFN-γ values; 3– natural logarithm converted uncorrected values; 4– natural logarithm converted corrected IFN-γ values
Fig. 1.1A: Six samples with IFN-γ levels (uncorrected TB2 values) between 0.46-0.77 IU/mL (median: 0.75 IU/mL) and time to result of 1200 s.
Fig. 1.2A Corrected TB2 values ranging between 0.36 and 0.68 IU/mL (median: 0.555 IU/mL)
Fig. 1.1B and 1.2B: Six samples with IFN-γ levels >10 IU/mL (uncorrected and correctedTB2 values) and time to result between 215-305 s (median: 245 s). Data transformation of TTR and IFN-γ of uncorrected and corrected TB2 values to a natural logarithmic scale showed a significantly high correlation (r = -0.913, p < 0.001 and r = -0.918, p < 0.001, respectively) between IFN-γ levels and TTR by linear regression analysis (Fig. 1.3 and 1.4). Corrected IFN-γ (Fig. 1.2) means IFN-γ levels with Nil subtraction. IFN-γ: interferon-γ; TB: tuberculosis.
Sensitivity of QIAreach QFT for detection of active TB was also 100%. Our assessment of this cohort of plasma samples revealed a single false-positive result from a healthy individual. This false-positive result case had normal CD4 and CD8 cell counts in blood; CD4: 1740/μL and CD8: 711/μL. TB1-Nil and TB2-Nil values measured by QFT-Plus were 0.01 IU/ml and 0.00 IU/ml, respectively, and TTR was 1200 s. In the active TB group, 7 participants aged 70-95 years (median age: 86 years) were immunocompromised (CD4 <200/μL) and tested positive by QIAreach QFT.
Relationship between IFN-γ level of positive sample and time to resultThe TTR was examined for all QIAreach QFT-positive results, because TTR is related to the level of fluorescent signal generated in the test. The TTR for QIAreach QFT- positive samples varied from 215-1200 seconds (20 min).
Fig. 1.1 shows the distribution plot of plasma IFN-γ concentrations in IU/ml (presented as uncorrected TB2 values without Nil subtraction) versus TTR for positive samples demonstrating negative correlation between TTR and IFN-γ in TB2 tube. Data transformation of TTR and IFN-γ to a natural logarithmic scale showed high correlation (r = -0.913, p < 0.001) between IFN-γ levels and TTR when linear regression analysis was performed (Fig. 1.3).
Six samples testing positive on QFT-Plus had IFN-γ levels (uncorrected and corrected TB2 values) >10 IU/mL (Fig. 1.1 B and Fig. 1.2.B). The TTR for these positive plasma samples, taken from patients aged 71-95 years (median age: 82 years), ranged from 215-305 seconds (median: 245 seconds). The range of the CD4 cell counts for these samples was between 138 and 1270 cells/µL (median: 529 cells/µL), and the CD8 cell counts ranged from 75-1230 cells/µL (median: 312 cells/µL). In comparison, six samples from patients aged 73-92 years (median age: 90 years) that tested positive on QIAreach QFT, with a TTR of 1200 seconds each, had IFN-γ levels on QFT-Plus (uncorrected TB2 values) ranging between 0.46 and 0.77 IU/mL (median: 0.75 IU/mL) (Fig. 1.1 A). Also, these 6 samples had IFN-γ levels on QFT-Plus (corrected TB2 values) ranging between 0.36 and 0.68 IU/mL (median: 0.555 IU/mL) (Fig. 1.2 A) showed positive results by QIAreach QFT. The distribution plot and correlation analysis using plasma IFN-γ values (corrected TB2 values) versus TTR for positive samples showed similar results (r = -0.918, p < 0.001) (Fig. 1.2 and 1.4).
The ranges of their CD4 and CD8 cell counts in blood were between 101 and 284 cells/µL (median: 209 cells/µL) and between 66 and 185 cells/µL (median: 115 cells/µL), respectively. Within this group of plasma samples, three came from immunocompromised patients, each with CD4 T-lymphocyte counts <200 cells/µL.
DiscussionThis is the first evaluation of a new diagnostic test, QIAreach QFT, in detecting TB infection compared with the QFT-Plus assay and as a screening tool for TB infection.
This new IGRA test is based on digital fluorescence LFA with nanoparticle technology. Similar to the QFT-Plus assay, it measures the levels of IFN-γ secreted from both CD4 and CD8 T lymphocytes in response to stimulation with M. tuberculosis-specific antigens, with advantages in use as point-of-care-test.24
The QIAreach QFT test exhibited high clinical performance: 100% sensitivity, 97.6% specificity, and 98.8% overall concordance using QFT-Plus as the reference standard. Sensitivity for detection of active TB was also 100%. The specificity and sensitivity of the QIAreach QFT assay reported here are comparable to those previously reported for the QFT-Plus assay. An assessment of the performance of the QFT-Plus assay among active TB patients and healthy individuals in Japan reported 96.2% sensitivity and 96.7% specificity.25 According to a meta-analysis of 15 published reports, the QFT-Plus assay had a pooled sensitivity of 94% for active TB patients and a pooled specificity of 96% for healthy individuals.26 A multicenter investigation into the performance of QFT-Plus test at three U.S. sites and two Japanese sites found the test to have 93.0% sensitivity in adult TB patients.27
Notably, the values of the IFN-γ levels shown in Fig. 1.1 and 1.3 are the uncorrected and corrected values of TB2 tubes of the QFT-Plus assay for all the samples tested—i.e., the level of IFN-γ in each TB2 tube without and with subtracting the level of IFN-γ of the Nil tube (background tube). Our results demonstrated that the cut-off point of IFN-γ concentration for QIAreach QFT assay might be similar to that of the QFT-Plus assay (0.35 IU/mL). We did find a statistically significant relationship between levels of uncorrected and corrected IFN-γ in plasma of active TB patients and TTR (natural logarithms conversion of each) with a linear regression analysis (r = -0.913, p < 0.001 and r = -0.918, p < 0.001, respectively) (Fig. 1.3 and 1.4). This study's results suggest that the higher the IFN-γ level of the sample, the shorter the TTR, which could be used as a surrogate marker of IFN-γ concentration in plasma when using QIAreach QFT assay. Like QFT-Plus, however, QIAreach QFT may have variations in measured IFN-γ values near the cutoff (i.e., 0.2 - 0.7 IU/mL), so there is a relatively high possibility of false negatives and/or false positives for the QIAreach QFT results with a TTR close to 1200 seconds.
Seven cases in the active TB group who were immunocompromised (CD4 <200/μL) returned positive results on QIAreach QFT, suggesting this assay could be considered a promising digital fluorescence LFA for detecting TB infection among immunocompromised patients. Larger studies on representative cohorts are needed to confirm its performance in those immunocompromised.
Our assessment of this cohort of plasma samples revealed a single false positive from a healthy individual. This was a sole sample with a high triglyceride level (1588 mg/dL) and was turbid following the freeze and thaw processes. Testing on this individual was repeated by obtaining a new sample exhibiting a high triglyceride level (1288 mg/dL) that was not subjected to freeze and thaw processes. A negative result was obtained. Various factors, such as sample viscosity, may have affected the development speed of the sample solution on the nitrocellulose membrane of the LFA system. Of note, the false-positive results of QIAreach QFT assay could be caused by milky plasma as well as autoimmune disease.28
The QIAreach QFT assay offers a number of workflow advantages over more complex laboratory-based assays, such as QFT-Plus (Table 1). The QIAreach QFT assay is objective—reporting test results as either positive or negative—and it requires only 1 mL of blood from each patient, compared with 4 mL of blood required for the QFT-Plus assay. In addition, the QIAreach QFT test results can be obtained within a relatively short time of up to approximately 20 min for each specimen analyzed. In contrast, the QFT-Plus test based on ELISA requires at least 150 min to obtain a readout. Moreover, the QIAreach system can be used for a single test or up to eight tests at a time for each eHub being used. The QIAreach QFT testing system and hardware can be used anywhere, like the QIAreach anti-SARS-CoV-2 total test.23 Implementing the QIAreach QFT testing system does not require any specialized instruments (e.g., an automated ELISA workstation), trained laboratory officers to perform ELISA or a dedicated laboratory space; importantly eHub is battery operated allowing its use in remote areas with limited electricity supply. These features make the QIAreach QFT a suitable and highly attractive test to detect TB infection in decentralized settings.
A TB diagnostic test with these characteristics is of particular value for screening efforts in countries with high TB prevalence.24 In 2019, TB cases in countries in Southeast Asia and Africa accounted for 69% of the total TB cases worldwide.1 However, these settings often lack the resources for maintenance and calibration, the infrastructure for complex instrumentation, and the specialized laboratory staff needed for older laboratory-based assays. Many of these low-resource settings that need TB infection screening are outside of major urban centers. The QIAreach QFT test will also be useful for TB infection screening among special groups, including—among others—immigrants,19 inmates,29 and children.
The study has clear limitations, including the fact it was conducted in a single center and on a convenience sample (i.e., being a preliminary study, no sample size calculation was performed), thus requiring larger studies to confirm the findings.
ConclusionsIn terms of clinical performance, the QIAreach QFT assay displayed 100% sensitivity, 97.6% specificity, and 98.8% overall concordance compared with the QFT-Plus test. This assay is objective, quicker to perform than QFT-Plus, and requires only a small amount of blood (1 mL) per test. The test offers flexibility in that it can be easily performed anywhere and is not restricted to a laboratory environment. This novel assay can be useful in screening for TB infection in high-TB-burden, low-resource countries and, also, for screening of immunocompromised patients. Larger studies are necessary to confirm these preliminary findings.
Authors’ contributionsAuthors’ contributions were as follows: study conception and design (FK, KT), acquisition of data (FK, AK, KA, KT), and analysis and interpretation of data (FK, KT, SN, MH). All authors have contributed substantially to drafting and revising the article critically for important intellectual content. All authors approved the submitted version of the article. K. Fukushima: Conceptualization, Data curation, Formal analysis, Investigation, Methodology, Validation, Visualization, Writing - original draft, Writing - review & editing. K. Akagi: Data curation, Writing - original draft, Writing - review & editing. A. Kondo: Data curation, Writing - original draft, Writing - review & editing. T. Kubo: Data curation, Formal analysis, Investigation, Methodology, Writing - original draft, Writing - review & editing. N. Sakamoto: Formal analysis, Investigation, Writing - original draft, Writing - review & editing. H. Mukae: Formal analysis, Investigation, Supervision, Validation, Visualization, Writing - original draft, Writing - review & editing. All authors approved the submitted version of the article.


