
An inspiratory capacity to total lung capacity (IC/TLC) ratio of ≤25% has emerged as a better marker of mortality in chronic obstructive pulmonary disease (COPD) patients. The relationship among the IC/TLC ratio to lower extremity skeletal muscle function remains unknown.
MethodsThirty-five men with moderate to severe COPD were divided into those with IC/TLC≤25% (n=16) and >25% (n=19). The subjects were tested for thigh muscle mass volume (MMT), maximal strength, power output of the lower extremities, and physical activity.
ResultsTotal MMT in the IC/TLC<25% group was significantly lower (413.91±89.42cm3) (p<0.001) than in the IC/TLC>25% group (575.20±11.76cm3). In the IC/TLC≤25% group, maximal strength of the lower extremities and muscle peak power output of the lower extremities were 36–56% lower (p<0.01) than among the patients in the IC/TLC>25% group.
ConclusionIC/TLC≤25% is associated with reduced maximal strength and peak power output of the lower extremities. IC/TLC≤25% may have an important clinical relevance as an index to determine peripheral muscle dysfunction.
Skeletal muscle dysfunction has been postulated as one of the extrapulmonary effects in patients with chronic obstructive pulmonary disease (COPD), resulting in reduced peripheral muscle strength and muscle mass.1,2 Reductions in muscle force production contribute to exercise intolerance and have been associated with an increased mortality risk and a decrease in quality of life.3,4 Lower extremity muscle power has been also recently posited as a more discriminating variable for understanding the relationship between impairments, functional limitations, and resultant disability with aging.5,6 Physical inactivity and systemic inflammation have been cited as factors responsible for muscle dysfunction in COPD.7,8 Considering that reductions in peripheral muscle strength have important clinical and functional implications for COPD patients, the search for effective pulmonary indices to predict peripheral muscle function is of paramount importance.
Among the pulmonary parameters, forced expiratory volume in 1 second (FEV1) is the most important spirometric indicator of the severity of airflow obstruction. However, several studies have shown the weak relationship between FEV1 and mortality,9,10 indeed, it cannot be used to detect abnormal skeletal muscle function. Recently, the inspiratory capacity-to total lung capacity (IC/TLC) ratio has emerged as a better marker of mortality and functional reserve and is associated with altered exercise capacity in COPD patients.11,12 Recently, Ramon et al.13 observed that the patients with COPD with lower IC/TLC experience a higher longitudinal decline in exercise capacity.
To date, only one study has investigated the role of IC/TLC ratio on the muscle function in the upper extremities in this population of patients. Its authors found that maximal hand grip strength was lower among IC/TLC≤25% than among patients with IC/TLC>25%.14 However, no previous studies have established the correlation between the IC/TLC ratio and lower extremity muscle mass, maximal strength, and muscle peak power output in this patient population.
Accordingly, the primary aim of the present study was to determine whether the inspiratory capacity-to-total lung capacity ratio or inspiratory fraction would be useful in predicting skeletal muscle dysfunction in the lower and upper extremities. We hypothesized that patients with IC/TLC≤25% would have less maximal muscle strength of the lower and upper extremities and peak power output of the lower limbs than IC/TLC>25% patients.
Materials and methodsSubjectsThirty-five men with stable COPD were recruited via an outpatient clinic through the local pulmonologist office to participate in the study. All patients had received a clinical and functional diagnosis of COPD according to the GOLD criteria (stages II and III). Patients presented with moderate-to-severe airways obstruction (FEV1/FVC<0.7 and FEV1<80% but FEV1>30% predicted). Inclusion criteria include: (1) dyspnea (mMMRC grades II and III); (2) ex-smokers status; and (3) aged 60–80 yrs. Exclusion criteria include: (1) having never smoked; (2) exacerbation of symptoms in the preceding three months; and (3) cardiovascular, neuromuscular, musculoskeletal or arthritic problems that might limit exercise tolerance. The patients were informed carefully about the procedures and possible risks of the experiments, as well as the benefits of the project, and written consent was obtained. The Research Ethics Committees of the Public University of Navarre and Virgen del Camino Hospital approved the study.
Pulmonary functional and clinical assessmentsBaseline assessment included: (1) spirometry, lung volumes by body plethysmography, maximal inspiratory and expiratory pressure according with recommended methods; (2) anthropometric variables; (3) 6-min, walk test (6MWT)15; and (4) BODE index.
Thigh muscle massMuscle mass (MM) of the thigh (T) were assessed using magnetic resonance imaging (MRI; 1.5T; Siemens Magnetom, Germany). The length of the femur (Lf), taken as the distance from the intercondylar notch of the femur to the superior boundary of the femoral head was measured on a coronal plane. Subsequently, 15 axial scans of the thigh interspaced by a distance of 1/15Lf were obtained from 1/15Lf to 15/15Lf. MR imaging of both thighs was obtained. Cross-sectional volumes (cm3) of the thigh at 30% proximal, 50%, and 70% distal of the Lf were used for further analysis. The total volume (cm3) of the MMT was calculated as the combination of the 30, 50, and 70% of the Lf.16
Physical activityHabitual physical activity was evaluated using accelerometry (TriTrac-R3D system; WI, USA). The TriTrac was worn around the waist. TriTrac monitoring was recorded on a minute-by-minute basis during two weekdays and two weekend days.
Lower extremity maximal strength and muscle peak power outputOne repetition maximum (the heaviest load that could be lifted only once using the correct technique) was determined for the leg press exercise (1RMLP) (Technogym, Gambettola, Italy). Three-to-four subsequent attempts were made to determine 1RM.16
The subjects were instructed to exert their maximal force as fast as possible.
Muscle peak power output of the leg extensor muscles was measured during the concentric phase of leg press using the load equal to 50 and 70% of 1RM. An optical encoder (Computer Optical Products Inc., CA, USA) was attached to weight plates to record the position and direction of the displacement to an accuracy of 0.2mm at 1000Hz. Subjects were instructed to displace the weights as fast as possible. Two testing trials were recorded and the best trial was taken for further analysis.
Upper extremity maximal strengthOne repetition maximum (1RM) was determined for seated chest press (1RMCP), shoulder press, and seated row (Technogym, Gambettola, Italy).16
Systemic inflammationAfter 10h of fasting and 1 day of minimal physical activity, venous blood samples were obtained at rest between 8 and 10a.m. from the antecubital vein for the determination of interleukin-6 (IL-6), tumor necrosis factor α (TNF-α), C-reactive protein (CRP), and plasma vascular endothelial growth factor A (VEGF-A) concentrations. Circulating concentrations of IL-6, TNF-α, CRP, and VEGF-A were assessed in duplicate using commercially available enzyme-linked immune absorbent assay and radioimmunoassay kits.
Statistical analysisStandard statistical methods were used to calculate mean and standard deviations (SPSS, Chicago, Illinois). Statistical treatment was performed using SPSS program version 23.0. The assumption of a normal distribution of the data was evaluated with a Shapiro–Wilk test. Cross-sectional comparisons between groups were performed by either a parametric (unpaired t-test) or a non-parametric test (Mann–Whitney U test). Pearson product-moment or Rho Spearman correlation coefficients were used to determine the association between variables of interests. Due to the small size of the sample, the p-value was simulated using bootstrap method with replacement procedure as part of the analysis. A random sample was designed with replacement from the original sample to produce a new sample of the same size as the original. This procedure was repeated for each sample separately, and the difference in mean calculated. This procedure was repeated 1000 times. The p<0.05 criterion was used to establish statistical significance. Values are reported as mean values±standard deviations (SD).
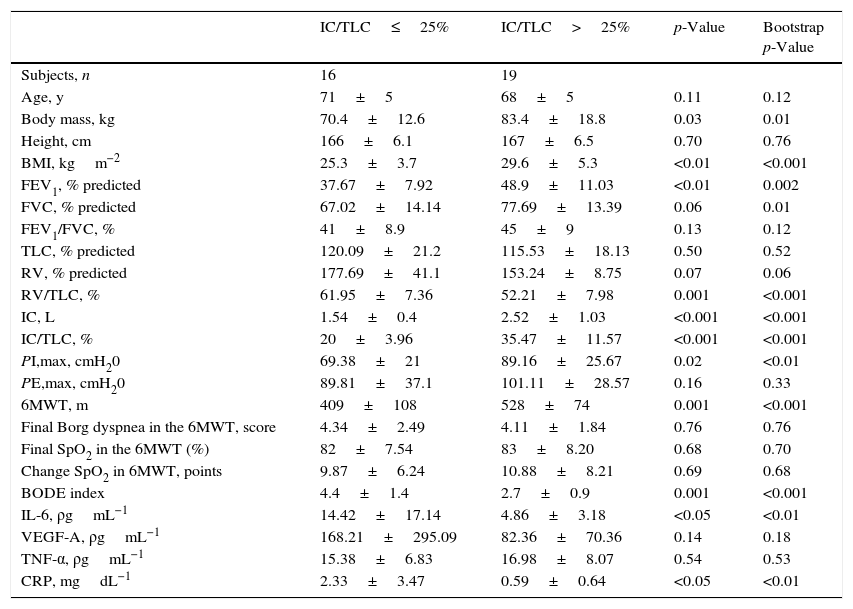
ResultsClinical characteristics and physical activityClinical characteristics according to the IC/TLC ratio are shown in Table 1. The 6MWT distance was lower (p=0.001; bootstrap p<0.001) and the BODE index was higher (p=0.001; bootstrap p<0.001) in the IC/TLC≤25% group. IL-6 and CRP concentrations were higher (p<0.05; bootstrap p<0.01) in the IC/TLC≤25% group. Habitual physical activity during the four days was 23% lower (7228±1459kcal vs. 9250±1952kcal, p<0.01; bootstrap p<0.001) in the IC/TLC≤25% group than in the IC/TLC>25% group.
Clinical, anthropometric characteristics and inflammatory markers in patients with chronic obstructive pulmonary disease according to inspiratory capacity to total lung capacity ratio.
| IC/TLC≤25% | IC/TLC>25% | p-Value | Bootstrap p-Value | |
|---|---|---|---|---|
| Subjects, n | 16 | 19 | ||
| Age, y | 71±5 | 68±5 | 0.11 | 0.12 |
| Body mass, kg | 70.4±12.6 | 83.4±18.8 | 0.03 | 0.01 |
| Height, cm | 166±6.1 | 167±6.5 | 0.70 | 0.76 |
| BMI, kgm−2 | 25.3±3.7 | 29.6±5.3 | <0.01 | <0.001 |
| FEV1, % predicted | 37.67±7.92 | 48.9±11.03 | <0.01 | 0.002 |
| FVC, % predicted | 67.02±14.14 | 77.69±13.39 | 0.06 | 0.01 |
| FEV1/FVC, % | 41±8.9 | 45±9 | 0.13 | 0.12 |
| TLC, % predicted | 120.09±21.2 | 115.53±18.13 | 0.50 | 0.52 |
| RV, % predicted | 177.69±41.1 | 153.24±8.75 | 0.07 | 0.06 |
| RV/TLC, % | 61.95±7.36 | 52.21±7.98 | 0.001 | <0.001 |
| IC, L | 1.54±0.4 | 2.52±1.03 | <0.001 | <0.001 |
| IC/TLC, % | 20±3.96 | 35.47±11.57 | <0.001 | <0.001 |
| PI,max, cmH20 | 69.38±21 | 89.16±25.67 | 0.02 | <0.01 |
| PE,max, cmH20 | 89.81±37.1 | 101.11±28.57 | 0.16 | 0.33 |
| 6MWT, m | 409±108 | 528±74 | 0.001 | <0.001 |
| Final Borg dyspnea in the 6MWT, score | 4.34±2.49 | 4.11±1.84 | 0.76 | 0.76 |
| Final SpO2 in the 6MWT (%) | 82±7.54 | 83±8.20 | 0.68 | 0.70 |
| Change SpO2 in 6MWT, points | 9.87±6.24 | 10.88±8.21 | 0.69 | 0.68 |
| BODE index | 4.4±1.4 | 2.7±0.9 | 0.001 | <0.001 |
| IL-6, ρgmL−1 | 14.42±17.14 | 4.86±3.18 | <0.05 | <0.01 |
| VEGF-A, ρgmL−1 | 168.21±295.09 | 82.36±70.36 | 0.14 | 0.18 |
| TNF-α, ρgmL−1 | 15.38±6.83 | 16.98±8.07 | 0.54 | 0.53 |
| CRP, mgdL−1 | 2.33±3.47 | 0.59±0.64 | <0.05 | <0.01 |
Values expressed in mean±SD. BMI=body mass index; FEV1=forced expiratory volume in one second; FVC=forced vital capacity; TLC=total lung capacity; RV=residual volume; IC=inspiratory capacity; PI,max=maximal inspiratory pressure; PE,max=maximal expiratory pressure; SpO2=arterial oxygen saturation measured by pulse oximetry; Change SpO2=SpO2 before minus SpO2 at the end of 6MWT.
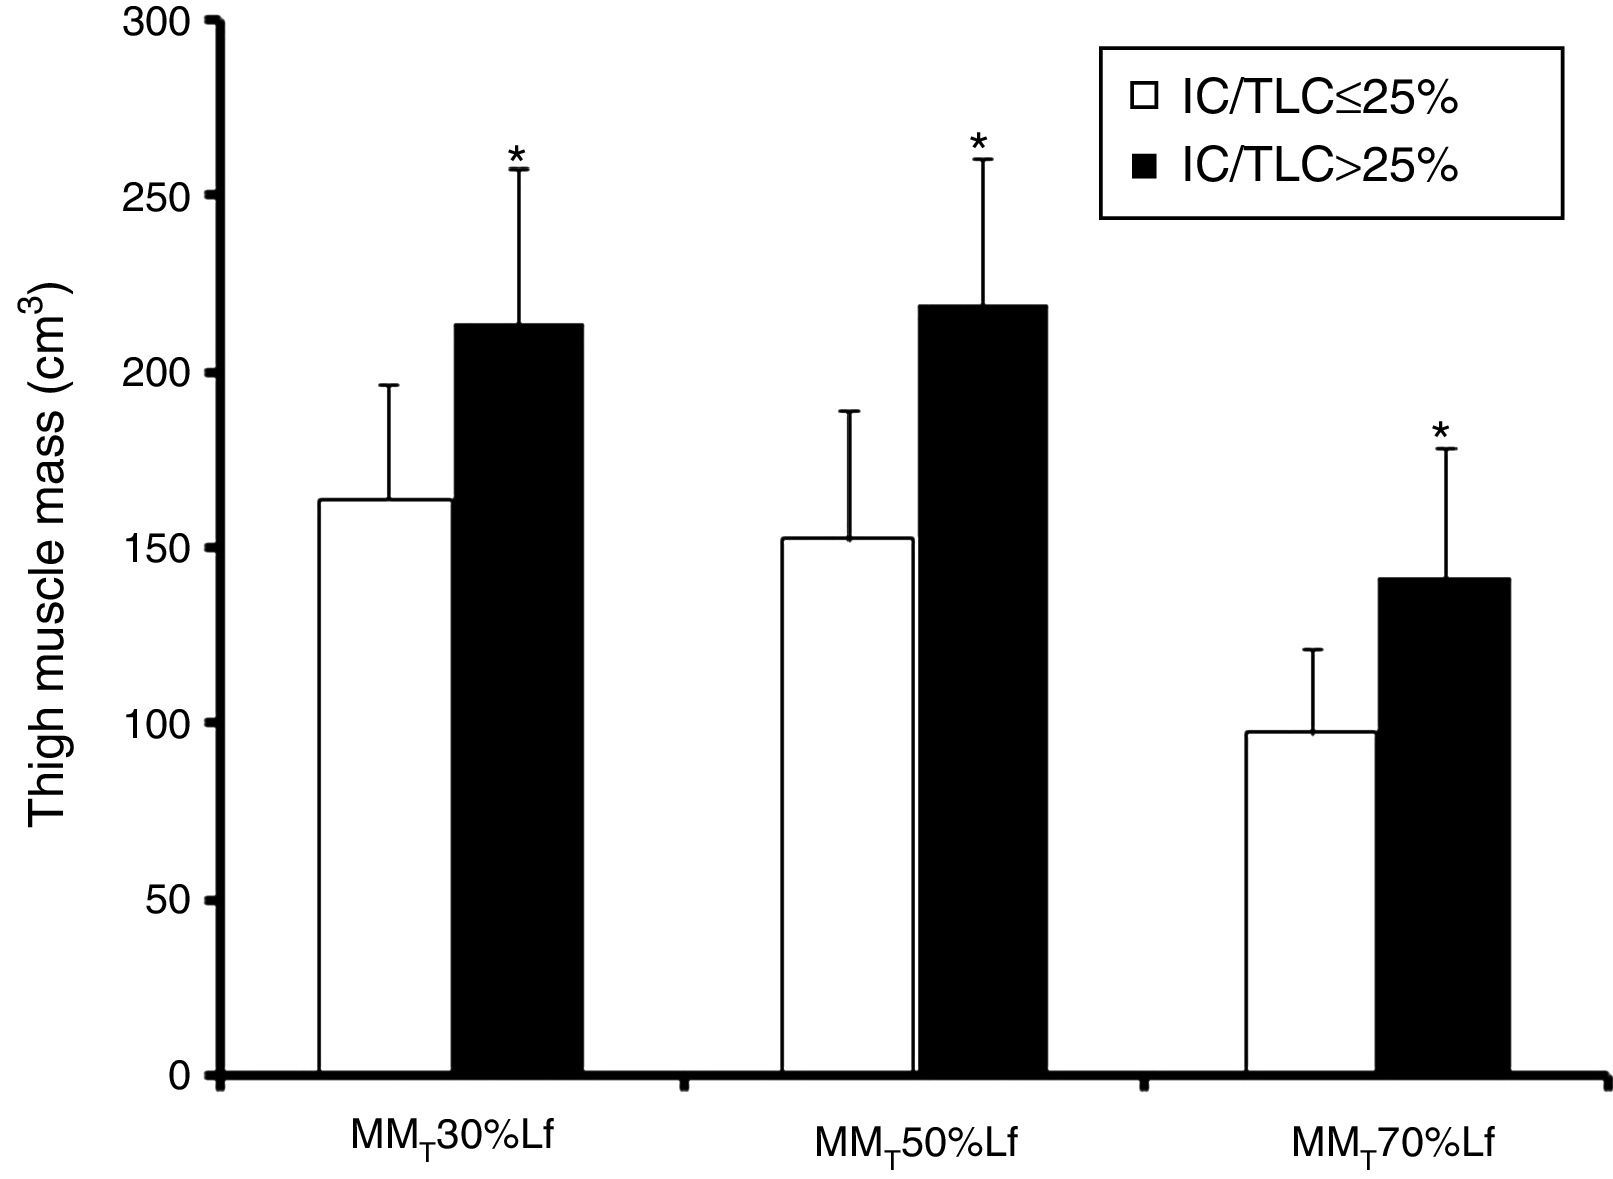
MMT volume at 30%, 50%, and 70% Lf were lower (p≤0.001; bootstrap p<0.001) in the IC/TLC≤25% group than in the IC/TLC>25% group (Fig. 1). Total MMT volume was lower (p<0.001; bootstrap p<0.001) in the IC/TLC≤25% group (413.91±89.42cm3) than in the IC/TLC>25% group (575.20±115.25cm3).
Lower extremity maximal dynamic strength and muscle peak power output at 30%, 50%, and 70% Lf according to IC/TLC ratio. Data are presented as means±SD. *p≤0.001 IC/TLC≤25% vs. IC/TLC>25%.")
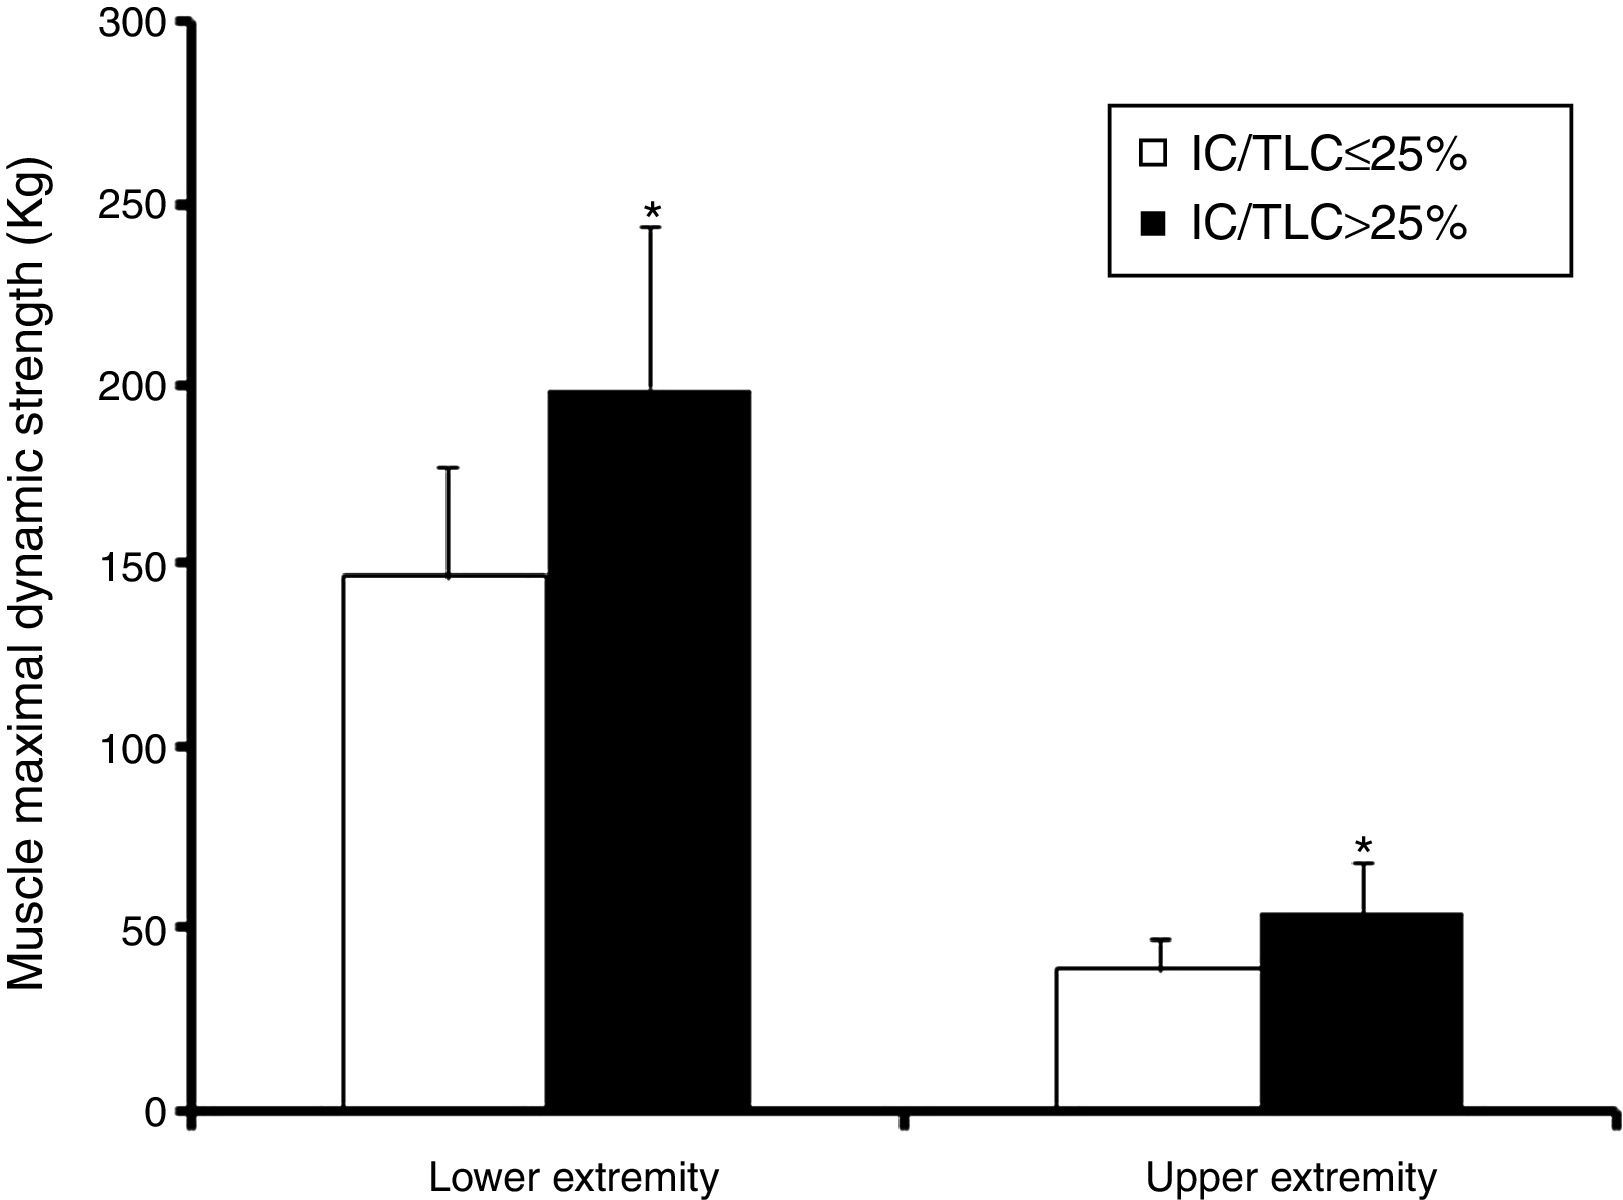
The 1RMLP exercise was 36% lower (p<0.00; bootstrap p<0.001) in the IC/TLC≤25% group (Fig. 2). Interestingly, when maximal bilateral concentric strength were expressed relative to total MMT volume, the differences between the groups disappeared (0.36±0.06 vs. 0.35±0.08kgcm−3, p=0.70; bootstrap p=0.73) in the IC/TLC≤25% and IC/TLC>25%, respectively.

Lower extremities muscle peak power output at 50 and 70% of 1 RM was 43% (495±192 vs. 711±216W, p<0.0; bootstrap p<0.001) and 56% (390±168 vs. 612±211W; p<0.01; bootstrap p<0.001) lower in the IC/TLC≤25% group, respectively. When muscle peak power output was expressed relative to kilogram of body mass, the difference was reduced to 26% at the load of 50% (6.89±1.95 vs. 8.74±2.77Wkg−1, p=0.032; bootstrap p=0.014) and 36% at the load of 70% (5.48±1.86 vs. 7.48±2.39Wkg−1, p=0.01; bootstrap p=0.002) in the IC/TLC≤25% than in the IC/TLC>25% group, respectively. When muscle peak power output was expressed relative to total MMT volume, the differences between the groups were abolished at the load of 50% of 1RM (1.2±0.3 vs. 1.3±0.3Wcm−3, p=0.35; bootstrap p=0.70) in the IC/TLC≤25% compared with the IC/TLC>25%, respectively.
Upper extremity maximal dynamic strengthThe 1RMCP was 42% lower (p<0.001; bootstrap p<0.001) in the IC/TLC≤25% group (Fig. 2). Maximal dynamic strength 1RM in the seated row and shoulder press was 25% lower (42.03±7.5 vs. 52.63±8.2kg; p<0.001; bootstrap p<0.001) and 29% lower (47.86±9.9 vs. 62.10±15.6kg, p=0.003; bootstrap p=0.002) in the IC/TLC≤25% group than in the IC/TLC>25% group, respectively.
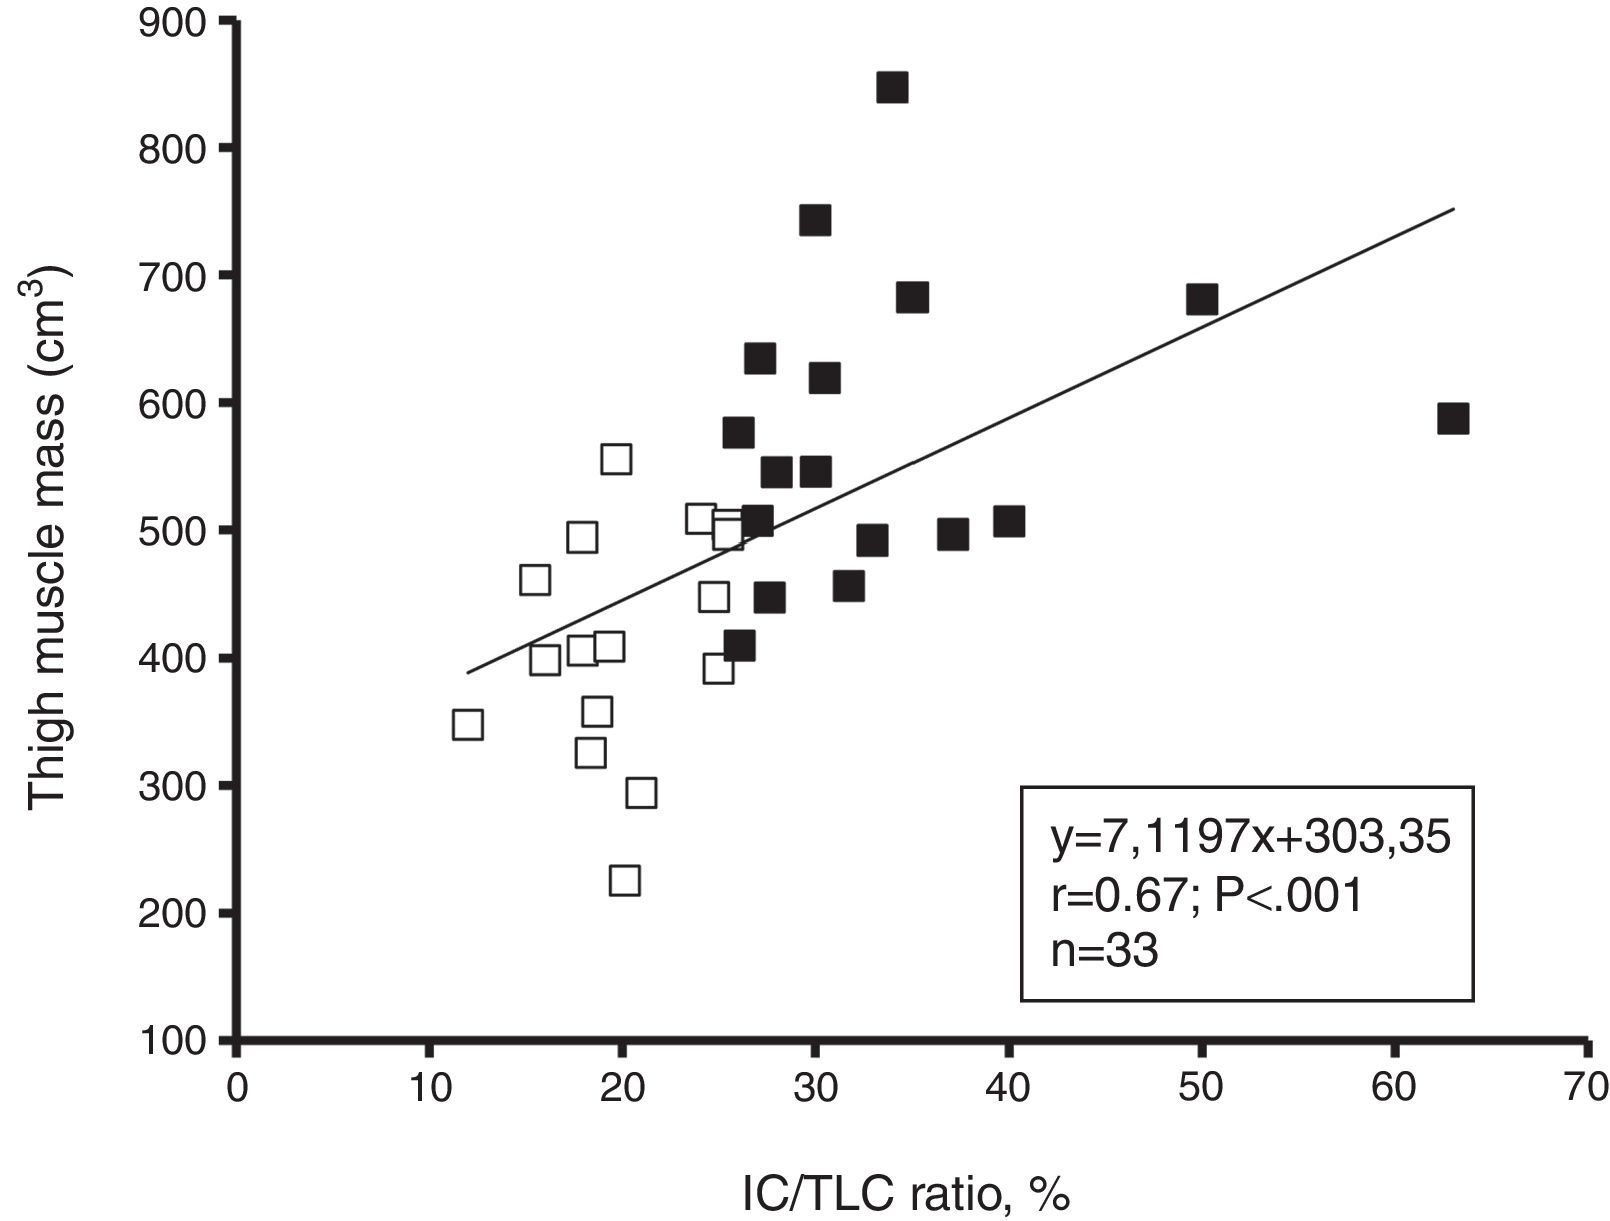
AssociationsThe IC/TLC ratio was positively associated with total MMT volume (Fig. 3), 1RMLP (r=0.57; p=0.001), 1RMCP (r=0.60; p<0.001) and physical activity (r=0.55; p=0.001) for the entire group. The FEV1 (% predicted) was positively associated with total MMT volume (r=0.46; p<0.01), 1RMLP (r=0.43; p=0.01), and physical activity (r=0.54; p=0.001) for the entire group. Moreover, physical activity was positively associated with total MMT volume (r=0.81; p<0.001), 1RMLP (r=0.62; p<0.001), and muscle power at 50% 1RM (r=0.78; p<0.001). In addition, a negative linear relationship was found between IL-6 and MMT volume (r=−0.40; p=0.02), 1RMLP (r=−0.50; p<0.01) and muscle power at 50% of 1RM (r=−0.46; p<0.01) for the entire group.
Discussion and IC/TLC>25% (■).")
The salient findings of this study were that thigh muscle mass, lower and upper maximal strength, and leg muscle peak power output was reduced significantly in COPD patients with IC/TLC≤25%. In addition, the IC/TLC a predictor of mortality, was related to thigh muscle mass and the maximal strength of lower and upper extremities. The present findings suggest that IC/TLC≤25% may be valued as an applicable index of skeletal muscle dysfunction in chronic obstructive pulmonary disease patients.
An inspiratory-to total lung capacity ratio of ≤25% is an important independent predictor of increased mortality.11 Recently, Ramon et al.13 observed that the patients with COPD with lower IC/TLC experience a higher longitudinal decline in exercise capacity and IC/TLC and dyspnea in clinically stable patients with COPD predict their exercise capacity.
On the basis of previous studies suggesting that lower fat-free mass and reduced grip strength is related to an IC/TLC of ≤25%,14 we sought to determine whether an IC/TLC of ≤25% would translate to unfavorable changes in muscle mass and muscle function (maximal strength and power output normalized to muscle cross-sectional area) in the lower extremities. Skeletal muscle weakness in the lower extremities has previously been shown to be more established with the increase of the dyspnea, BODE index score, and disease severity in COPD patients.17 Previous studies have observed that reduced thigh muscle cross-sectional area3 and reduced maximal quadriceps strength,1 which result in an impaired functional capacity,18 is related to increased mortality19 and health care utilization.4 Recently, it has been also reported that lower extremity muscle power remains as a more discriminating variable for understanding the relationships between impairments, functional limitations, and resultant disability with aging.5,6 However, no previous study has determined that the IC/TLC ratio is a marker of muscle atrophy and reduced maximal strength and muscle power output in the lower limbs in COPD patients.
A unique findings in this present study was that thigh muscle mass and maximal dynamic strength in the lower limbs were lower in the IC/TLC≤25% group. This hypothesis was strengthened by the relationship observed between the IC/TLC and muscle mass (r=0.67; p<0.001) and lower maximal strength (r=0.57; p<0.01). In this study, we extended our investigation by determining the relationship between the IC/TLC>25% group and the maximal strength of the upper limbs. Indeed, reduced maximal strength in the upper extremities was found in the IC/TLC≤25% group. This suggests that the inspiratory-to-total lung capacity ratio of ≤25% is a surrogate marker of thigh muscle atrophy and peripheral skeletal muscle weakness.
Recently, impairments in muscle peak power output in the lower extremity have emerged as a more important predictor of limitations in mobility in tasks such as rising from a chair, climbing stairs, habitual walking speed, and even the prevention of falls, than maximal muscle strength in older adults.20–24 To the best of our knowledge, this is the first study to report the association between the IC/TLC ratio and lower extremity muscle peak power in patients with COPD. Our results indicate that muscle peak power output at 50 and 70% of 1RM is reduced in COPD patients with an IC/TLC of ≤25%. Furthermore, a slowed-down capacity for muscle power output and delayed responsiveness to accidental falls in the lower and upper limbs is associated with disability.5,6 It has been documented that in older adults25 with lower extremity power at high velocities (40% 1RM) contractions were a better predictor of habitual gait velocity than power at low velocities (70% 1RM). One of the major findings in this study was that when maximal bilateral dynamic strength and muscle power output were expressed relative to total MMT, the differences between the groups disappeared. This suggests that the impairment in peripheral muscle function of the lower limbs in patients with IC/TLC≤25% is mainly due to loss of muscle mass and that neural activation patterns and/or twitch tension per muscle mass volume under maximal concentric actions (typical leg extension actions also in normal daily activities) could be rather similar between groups.
It is no clear which physiological mechanisms explained the reductions in muscle mass in COPD patients with an IC/TLC of ≤25%. In healthy older adults, reduced maximal strength has been attributed to a great extent to the reduction in muscle mass, which is perhaps related to alterations in hormone balance26 and the decline in the quantity and intensity of physical activity.27 In this context, we postulated that lower limb muscle mass and reductions in maximal strength and peak power output might be due to elevated inflammation and the physical inactivity associated with the systemic inflammation.28,29 Consistent with the first part of the hypothesis, we found that patients with an IC/TLC of ≤25% have elevated CRP and IL-6 levels and also, we observed a negative relationship between IL-6 and muscle mass, lower extremity maximal dynamic strength and leg muscle peak power output. Therefore, the present results might indicate that the effects of circulating IL-6 may be associated with reduced muscle mass and skeletal muscle weakness. The results contradict the findings of Pleguezuelos et al.30 who did not observe any significant relationship between quadriceps strength and IL-6. These differences might occur because of the maximum strength measurement (i.e., dynamic maximum test vs. isokinetic test). Previous studies have shown that higher levels of systemic inflammation are associated with reduced physical activity in patients with COPD,7 and the older adults who are physically inactive have higher levels of systemic inflammatory markers than those who are physically active.31 In support of the second part, the IC/TLC≤25% group demonstrated a 23% lower habitual physical activity. Moreover, physical activity was positively associated with lower extremity maximal strength, muscle power output, and thigh muscle mass in the pooled group. In the present study, IC/TLC ratio was positively associated with physical activity (r=0.55; p=0.001) for the entire group, suggesting that those patients with higher static hyperinflation (low IC/TLC) are less physically active. A limitation of our study is that there was no direct dynamic hyperinflation during the 6MWT measurements. Garcia-Rio et al.32 have reported that the reduced daily physical activity of patients with moderate-severe COPD might be partially explained by the development of dynamic hyperinflation, regardless of the severity of the disease. Garcia-Rio et al.32 have showed that the increase in EELV during exercise was associated with dyspnea as evaluated by the MRC scale. This breathlessness could promote the limitation when the patients performed their daily physical activity, increasing the physical inactivity. At the same time, this physical inactivity could contribute to the weakness and atrophy of the muscles, leading to a vicious circle that causes more physical inactivity, atrophy and skeletal muscle dysfunction.
There are several methodological limitations in our experimental approach. First, as the size of the sample in the study was small, we used the bootstrapping procedure as part of the statistical analysis, strengthening our results. Second, we did not take into account patients who received corticosteroids. Previous studies1 have shown that quadriceps strengthened but thigh muscle mass was lower in those patients who received systemic corticosteroids. However, the patients in our study received the same medical treatment and exacerbation was an exclusion criteria.
In conclusion, the results of this study indicate that the inspiratory-to total lung capacity ratio may be an effective pulmonary measurement to determine muscle atrophy in the lower extremities and skeletal muscle dysfunction. The relationship observed is clinically important because an IC/TLC of ≤25% can be used as an index to detect skeletal muscle weakness.
Ethical responsibilitiesProtection of human and animal subjectsThe authors declare that the procedures followed were in accordance with the regulations of the relevant clinical research ethics committee and with those of the Code of Ethics of the World Medical Association (Declaration of Helsinki).
Confidentiality of dataThe authors declare that they have followed the protocols of their work center on the publication of patient data.
Right to privacy and informed consentThe authors have obtained the written informed consent of the patients or subjects mentioned in the article.
Conflicts of interestThe authors have no conflicts of interest to declare.
This study was conducted with the support of the Spanish Ministry of Education and Science (Plan Nacional I+D+i 2004-2007 y 2008-20011 Strategic action: “Sport and physical education” Ref: DEP2007-73220, DEP2011-30042) and Health Sciences Department of Government of Navarre.


